


















Lesson 18 of 43 · Transportation and Mobility
Public Transit
Understand how public transit works: the ladder of modes from bus to metro, why frequency beats coverage for riders, how stops are spaced and how networks are designed.
Why do some bus lines carry crowds while others run nearly empty? The answer is rarely the vehicle. It is almost always some mix of frequency, speed, reliability, walking access and the number of people living and working within walking distance of the stops. Transit is a service, and riders choose it the way shoppers choose a shop: if it is convenient and quick enough compared with the alternative, they use it.
This lesson explains the main modes, the arithmetic of waiting time, how stop spacing creates a trade-off, and how planners design networks. You will compute door-to-door times and see for yourself why frequency is the most valuable feature a transit line can have.
What you will learn
- The main transit modes and when each makes sense.
- Why average waiting time is half the headway, and why frequency matters.
- How stop spacing trades walking time against in-vehicle time.
- Principles of network design: grids, hubs, transfers and speed.
Key terms
Headway: the time between consecutive vehicles on a line.
Frequency: vehicles per hour; the inverse of headway.
Bus rapid transit (BRT): bus service with dedicated lanes, high-quality stations and fast boarding, giving rail-like performance.
Fare recovery: the share of operating costs covered by passenger fares.
First and last mile: getting from home to the stop and from the stop to the destination.
The modes
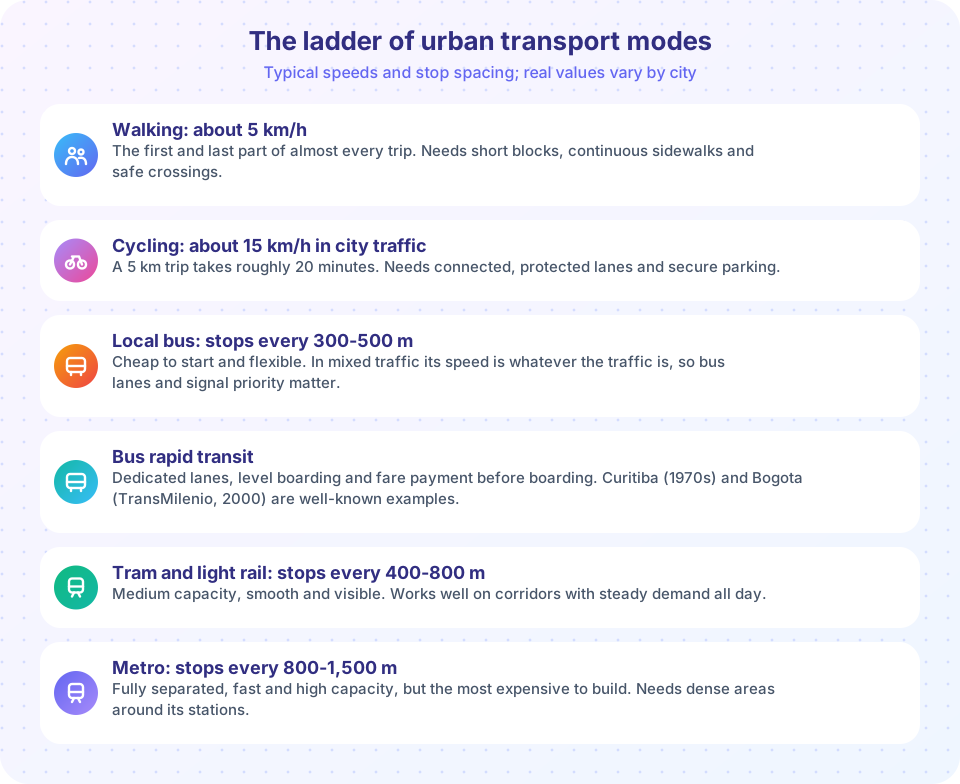
The picture above shows a ladder of urban modes. A few notes on each.
Local bus. The workhorse of most cities. It is cheap to start, needs no special infrastructure and can serve any street. In mixed traffic, though, a bus moves at the speed of traffic and stops at red lights and at every stop, so average speeds are often 12 to 20 km/h.
Bus rapid transit (BRT). BRT takes the bus and gives it the features that make a metro fast: lanes separated from traffic, stations with level boarding, fare payment before boarding and priority at signals. The idea was pioneered in Curitiba, Brazil, in the 1970s under the mayor Jaime Lerner, and spread widely, including to Bogota, whose TransMilenio opened in 2000. BRT can cost a small fraction of rail per kilometer, though it needs enough street space.
Tram and light rail. Electric vehicles on rails, in the street or on their own right-of-way. They offer smooth, quiet operation and good capacity on corridors with steady demand. Many European cities have rebuilt tram networks since the 1980s.
Metro (heavy rail). Fully separated, usually underground or elevated, with high speeds and the highest capacity, often tens of thousands of passengers per hour per direction. Metro is the right solution for the densest corridors, and the most expensive: tunnelling can cost many times more per kilometer than BRT or trams.
Commuter and regional rail. Longer-distance trains linking suburbs and nearby towns to the center, with fewer stops.
There is no universal winner. The right mode depends on demand, street space, budget and how much of the line can be separated from traffic.
Why frequency matters
When a bus runs every 10 minutes, you can turn up at the stop without checking a timetable. When it runs every 60 minutes, you must plan your day around it. Riders feel this difference strongly, and so planners treat frequency as a core quality of the service. A useful result follows from a simple fact: if passengers arrive at random, the average wait is half the headway. A bus every 10 minutes means an average wait of 5 minutes; a bus every 60 minutes means an average wait of 30 minutes.
Transit writer Jarrett Walker, in his book Human Transit (2011), argues that cities face a basic choice between coverage (serving every area, even with low frequency) and ridership (concentrating service where it will be used most, with high frequency). Both are legitimate goals, but they pull in opposite directions with a limited budget, and a good plan is explicit about the balance.
Frequent service also makes transfers workable. If every line runs every 10 minutes, a transfer costs at most a few minutes, and a grid of frequent lines lets people travel between many points with one or two transfers. That is the logic behind the "frequent network" approach adopted in cities such as Houston (2015 bus network redesign) and Auckland.
Stop spacing: a trade-off
Stops close together reduce walking but slow the vehicle: every stop adds time for braking, boarding and accelerating. Stops far apart do the reverse. Typical spacing is 300 to 500 meters for local buses, 400 to 800 for trams and 800 to 1,500 for metros. A simple model shows the trade-off. If stops are s meters apart, a rider's average walking distance to the nearest stop is about s/4 at each end of the trip. In-vehicle time depends on the speed between stops and the delay at each stop. The total is smallest at some middle spacing. The JavaScript example below computes this for a stylized trip.
Designing a network
A few principles recur in good network design.
- Go where people are. Transit needs density of homes and jobs along its route. This is why TOD and transit planning go together.
- Keep routes straight and simple. Detours save a few passengers a short walk but cost everyone else time.
- Make a connected network. A grid of crossing lines lets people travel between many pairs of places, whereas a pure hub-and-spoke network forces everything through the center.
- Speed it up. Bus lanes, signal priority, all-door boarding and fewer stops cut travel time, which raises ridership and lowers cost per passenger.
- Fares and information. Simple fares, easy transfers and clear real-time information make service easier to use.
- Reliability. People value predictable trips; a bus that is often late is a bus people avoid.
Cost and subsidy are part of the picture too. Almost no transit system covers all its costs from fares: in many cities fares cover somewhere between a quarter and two thirds of operating cost, with the rest paid by taxes, because transit produces wider benefits, such as less congestion, lower emissions and access to jobs for people without cars. How much subsidy is appropriate is a political question that varies between countries.
Common misconceptions
"People don't ride transit because they love cars." Many people choose according to time and cost. Where transit is frequent, fast and goes where they need to go, large numbers use it, in every income group.
"Rail is always better than buses." Rail has advantages in capacity and image, but BRT can deliver similar performance for far less money in the right conditions. The best mode depends on the corridor.
"More routes means better service." Spreading a fixed budget across many routes means each runs less often, so waiting rises. Often, fewer, more frequent lines serve more people.
Try it
Compare the door-to-door time of a car trip and a bus trip for a 6 km journey. Change the numbers (headway, walking distances, parking search) to see when each wins. The values are illustrative assumptions.
Press Run (or Ctrl + Enter) to see the result here.
Program input · what you'd type while the program runs
Type the answers before you press Run, one per line. Each time the program reads a line (with input()), it gets the next line from this box.
Next, the stop-spacing trade-off. For a 6 km trip, compute total travel time for different spacings. The model is stylized: average walking is a quarter of the spacing at each end, cruise speed is 30 km/h, and each stop costs 40 seconds in braking, boarding and acceleration.
Press Run (or Ctrl + Enter) to see the console output here.
No output.
Check your understanding
Quick check · 5 questions
of 5 answered You scored / 5 · perfect!
-
1. A bus runs every 20 minutes. If passengers arrive randomly, the average wait is:
Average wait is half the headway: 20 / 2 = 10 minutes. -
2. Where was bus rapid transit pioneered?
Curitiba developed BRT in the 1970s under mayor Jaime Lerner; Bogota's TransMilenio opened in 2000. -
3. Which pair describes Jarrett Walker's basic transit trade-off?
Cities must balance serving everywhere (coverage) against serving where demand is highest (ridership). -
4. Wider stop spacing generally:
Fewer stops mean faster in-vehicle trips but longer walks to a stop. -
5. Which is a key BRT feature?
BRT combines dedicated lanes, level boarding, off-vehicle fares and signal priority.
Summary
- Modes form a ladder from walking to metro; the best fit depends on demand, street space and budget.
- Average waiting time is half the headway, so frequency is the most valuable feature of a line.
- Stop spacing trades walking against ride time; a connected, simple, fast network beats many thin routes.
- Fares rarely cover all costs; subsidy reflects wider benefits and is a political choice.
Track your progress
Create a free account to tick off lessons and pick up where you left off on any device.
of Urban Planning lessons completed