


















Lesson 23 of 43 · Housing and Equity
Segregation and redlining
Trace how 1930s lending maps, restrictive covenants and urban renewal shaped segregated cities, how the Fair Housing Act responded, and how to measure segregation.
Walk across almost any large city and you can feel a boundary: the trees grow thicker on one side, the lots are larger, the buses run less often on the other. These patterns are not accidents of taste. In many countries they were built on purpose, through laws, lending rules and planning decisions that told different groups of people where they could live and which neighborhoods deserved investment.
This lesson follows the history that planners must understand before they propose any housing policy. It focuses on the United States, where the record is best documented, then looks at examples elsewhere and finishes with ways to measure segregation and to see how mild preferences can still produce stark separation.
What you will learn
- Explain what redlining was and who created the maps.
- Describe restrictive covenants, urban renewal and the Fair Housing Act.
- Give examples of segregation outside the United States.
- Calculate the dissimilarity index and interpret it.
- Explain what the Schelling model shows and what it does not show.
Key terms
Redlining: the practice of denying or limiting loans and insurance in particular neighborhoods, often because of the race or ethnicity of residents.
Restrictive covenant: a clause in a property deed forbidding sale or rental to certain groups.
Urban renewal: mid-twentieth-century programs that cleared "blighted" areas, often displacing the people who lived there.
De jure segregation: separation required by law. De facto: separation that exists in practice without being mandated.
Dissimilarity index (D): a number from 0 to 1 that shows how unevenly two groups are spread across areas.
Redlining: lending by map
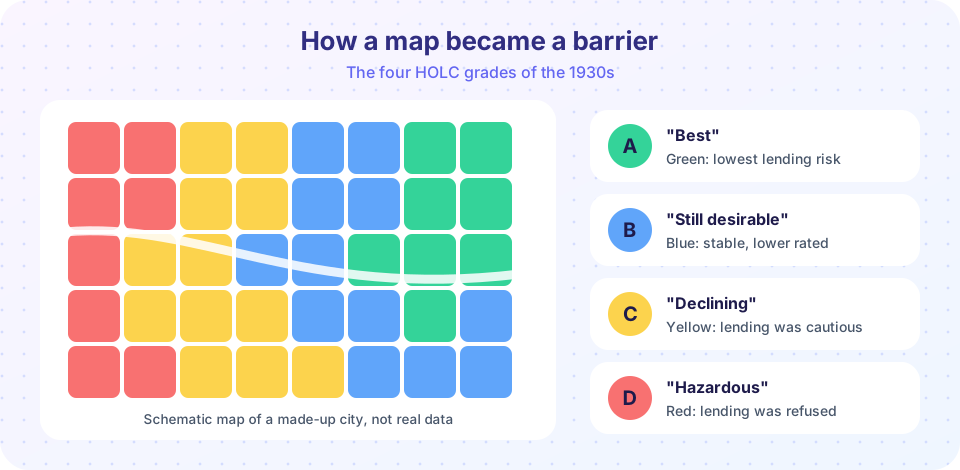
During the Great Depression, the United States created the Home Owners' Loan Corporation (HOLC) in 1933 to refinance mortgages for families at risk of losing their homes. A few years later, HOLC and related federal agencies commissioned "residential security maps" for hundreds of cities. Surveyors graded neighborhoods from A to D and shaded them green, blue, yellow or red. The red areas, labeled "hazardous," were drawn heavily around neighborhoods where Black and immigrant families lived. The Federal Housing Administration (FHA), founded in 1934, used similar risk reasoning when deciding which mortgages to insure, and its underwriting manuals favored racially uniform neighborhoods.
Historians continue to debate exactly how much the HOLC maps themselves caused lenders' decisions, since private banks also practiced discrimination and the maps were not a public lending ban. What is well established is that federal agencies and private lenders together steered mortgage money toward some neighborhoods and away from others, and that the resulting patterns of investment lasted for generations. Researchers who compare formerly redlined areas with their neighbors still find differences in home values, tree cover and heat exposure today, though they caution that redlining was one cause among several and that other forms of discrimination mattered as well.
Covenants, steering and renewal
Restrictive covenants wrote exclusion into property deeds. In the 1948 case Shelley v. Kraemer, the US Supreme Court held that courts could not enforce them. That did not end the practice overnight: real estate agents steered buyers by race, lenders kept tightening credit, and neighborhood associations pressured sellers. Meanwhile, large federal investments in highways and mortgage insurance helped white families move to the suburbs, while many city centers lost population and tax revenue.
The Housing Act of 1949 launched urban renewal, which cleared neighborhoods judged to be slums and replaced them with new buildings, highways or public housing. Many of the cleared neighborhoods were Black communities, and many residents were never rehoused nearby. The writer James Baldwin famously called it "Negro removal," a phrase that captured how people at the time experienced the programs. The Fair Housing Act of 1968 (Title VIII of the Civil Rights Act) finally banned discrimination in the sale, rental and financing of housing based on race, color, religion and national origin, and later amendments added sex, disability and family status.
Segregation beyond the United States
Segregation takes different forms in different places, and planners should not assume the American story applies everywhere.
- South Africa enforced racial separation by law. The Group Areas Act of 1950 assigned neighborhoods to racial groups and led to forced removals, such as those in District Six in Cape Town. Many cities still reflect that spatial design.
- France has large social-housing estates on city edges (the banlieues), where concentrated disadvantage and distance from jobs have been long-running policy concerns.
- Many cities in Latin America and South Asia show sharp divisions between planned districts and informal settlements, shaped by class, land ownership and migration.
- European cities often have a mix of public and private rental housing; segregation by income and migrant background is common, but patterns vary widely by country.
Measuring segregation
Planners and researchers measure segregation to track change over time. The most common single number is the dissimilarity index:
D = 0.5 × Σ | a_i / A − b_i / B |
Here a_i and b_i are the populations of group A and group B in area i (a census tract, say), and A and B are the citywide totals. D equals the share of either group that would have to move to a different area for both groups to be evenly spread. A value of 0 means perfect evenness, and 1 means complete separation. Researchers often describe values above about 0.6 as high, though that line is a convention, not a law.
D has limits. It measures evenness, not exposure (how often members of one group meet another), and it depends on how the areas are drawn. Planners often pair it with other measures, such as an isolation index that tells you the typical share of the same group in a person's neighborhood.
Why mild preferences can produce sharp separation
In 1971, the economist Thomas Schelling published a simple model of how segregation can emerge. Imagine a grid with two kinds of residents and some empty cells. Each resident is content if at least a certain share of neighbors are like them, and moves to a random empty cell if not. Schelling found that even when each household accepts being a minority in its neighborhood and only wants, say, one-third of neighbors like themselves, repeated moves lead to large clusters of the same type.
The lesson is subtle. The model does not prove that segregation is natural or harmless, and it ignores the power of laws, lenders and prices that real history includes. What it shows is that outcomes at the city scale can look much more extreme than the preferences of any single household, which is why planners cannot read individual attitudes straight off a segregation map.
Common misconceptions
"Segregation just reflects what people choose." Choices operate inside constraints: prices, lending, information, zoning and discrimination. Fair housing law exists precisely because choice was restricted.
"The Fair Housing Act ended the problem." It banned explicit discrimination, but patterns built over decades, including wealth differences and exclusionary zoning, change slowly.
"The red maps were the only cause." They are a famous symbol, but the real mechanism involved many actors and policies.
Try it
First compute the dissimilarity index for two made-up cities that have the same overall population but different spatial patterns.
Press Run (or Ctrl + Enter) to see the result here.
Program input · what you'd type while the program runs
Type the answers before you press Run, one per line. Each time the program reads a line (with input()), it gets the next line from this box.
Now watch Schelling's model run. Press Step or Run, and drag the slider to change how picky residents are. This is a toy demonstration of a model, not a prediction about any real place.
Check your understanding
Quick check · 5 questions
of 5 answered You scored / 5 · perfect!
-
1. What did HOLC's residential security maps do?
The maps graded neighborhoods by perceived lending risk, with D (red) marked as hazardous. -
2. What did Shelley v. Kraemer (1948) decide?
The Supreme Court held that judicial enforcement of racial covenants was unconstitutional, though discrimination continued by other means. -
3. A dissimilarity index of 0 means
D = 0 means each area has the same group mix as the whole city. -
4. What is the main lesson of the Schelling model?
City-scale patterns can be far more extreme than any individual's preferences, but the model ignores laws and lending. -
5. Which law banned discrimination in sale, rental and financing of housing in the US in 1968?
The Fair Housing Act (Title VIII of the Civil Rights Act of 1968) did this; the Group Areas Act was South African.
Summary
- HOLC maps and FHA underwriting graded neighborhoods and steered credit; covenants, steering and urban renewal reinforced separation.
- The Fair Housing Act of 1968 banned discrimination, but history leaves lasting patterns.
- Other countries have their own forms: legal apartheid, housing estates, formal and informal divides.
- The dissimilarity index measures evenness; no single number tells the whole story.
- Schelling's model shows how outcomes can exceed individual preferences without excusing real discrimination.
Next: Housing policy tools
Track your progress
Create a free account to tick off lessons and pick up where you left off on any device.
of Urban Planning lessons completed