


















Lesson 27 of 43 · Public Space and Design
Streets and human scale
Learn how planners design streets for people: eyes on the street, human scale, complete streets, the street cross-section and why speed matters most for safety.
Streets take up a huge share of a city's land, often a quarter or more of the developed area, and they are the place where most public life happens. For most of the twentieth century, engineers designed them mainly to move cars quickly. In the last sixty years, a different tradition has grown that asks a plainer question: what is the street like for a person standing, walking, sitting or cycling there?
In this lesson you will meet the thinkers who changed how planners see streets, learn to read a street cross-section like a budget, and see why speed is the variable that matters most for safety.
What you will learn
- Explain eyes on the street, human scale and the lessons of Whyte's plaza studies.
- Read a street cross-section and allocate its width.
- Describe a complete street and its safety features.
- Explain how vehicle speed affects injury risk.
- Estimate walking distances and times.
Key terms
Human scale: proportions and distances that fit the human body, eyes and walking pace.
Eyes on the street: Jane Jacobs's idea that constant activity from residents and shopkeepers watching the street makes it safer.
Cross-section: a slice through a street showing how its width is divided among uses.
Complete street: a street designed for all users, including walkers, cyclists, transit riders and drivers, of all ages and abilities.
Vision Zero: a policy goal of eliminating traffic deaths and serious injuries, first adopted in Sweden in 1997.
Three thinkers who changed how we see streets
In 1961, the writer and activist Jane Jacobs published The Death and Life of Great American Cities, a book that criticized large-scale clearance and highway projects. She argued that safe, lively streets depend on a mix of uses, short blocks, old and new buildings, and enough people to keep the place busy at different hours. Her best-known idea is eyes on the street: when shopkeepers, residents and passers-by naturally watch what happens outside, people feel safer, and it is not the police or the fences that do the work. Her ideas are widely taught, though critics point out that she wrote mostly from a few New York neighborhoods and that some of her conclusions do not transfer to every city.
The Danish architect Jan Gehl began studying how people actually use city space in the 1960s. His book Life Between Buildings (first published in Danish in 1971) showed that people respond to details at eye level: edges where they can stop, benches, windows, and the distance and speed of everything nearby. He later helped redesign pedestrian streets in Copenhagen and many other cities, and promoted the notion of designing "cities for people" rather than for traffic.
The American urbanist William H. Whyte led the Street Life Project in New York in the 1970s, filming plazas and counting how people used them. His book The Social Life of Small Urban Spaces (1980) reported a set of plain findings: people sit where there are places to sit; movable chairs are popular because they allow choice; sun, trees, water and food attract crowds; and a plaza near a busy street corner is used more than a hidden one. Many designers now treat the plain details he recorded as a checklist.
Human scale
A street feels human scale when its parts relate to the body. A person walking covers about 1.4 meters per second, which is roughly 5 kilometers per hour. At that speed you can notice a shop window, read a sign and greet a neighbor. In a car at 50 kilometers per hour, you cannot; the designer has to make everything bigger, simpler and farther away. Gehl observed that we can see a person's face and expression at about 25 meters and read emotions at 7 meters or less. Buildings with doors and windows at street level every few meters feel interesting to pass; a blank wall or parking lot of the same length feels long and dull.
Kevin Lynch, in The Image of the City (1960), asked residents to sketch their cities and found they described five kinds of elements: paths, edges, districts, nodes and landmarks. A good public realm gives people a clear mental map: they know where they are, how to get somewhere, and where the center of activity is.
Reading a cross-section
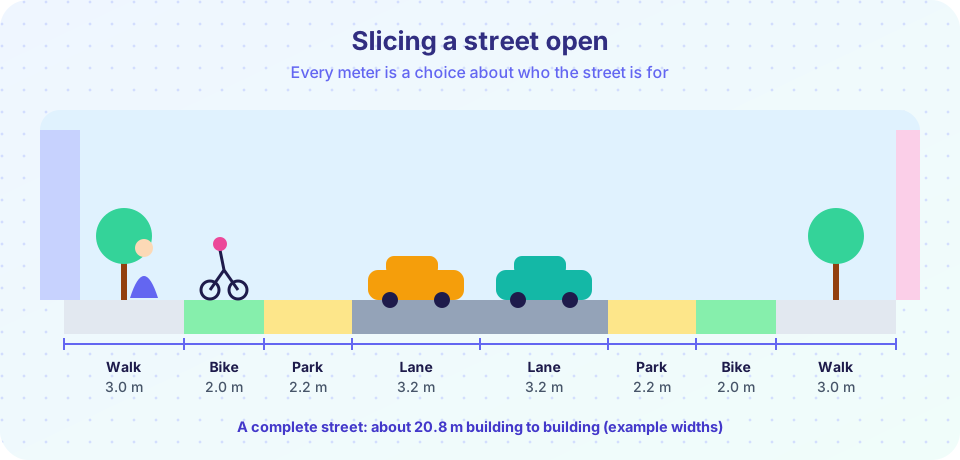
The width between buildings is fixed, so each use competes for it. The picture above shows an example width of about 21 meters divided among sidewalks, bike lanes, parking or planting strips and two travel lanes. A designer decides how to split the space: more sidewalk and trees, or more lanes for traffic; a protected bike lane, or parking; a lane for buses. Typical values used in practice include travel lanes of about 3.0 to 3.5 meters, sidewalks with at least 1.5 meters of clear walking width (more where there are many pedestrians), and protected bike lanes of roughly 1.5 to 2.5 meters depending on volume. Local standards vary, so treat these as a rough guide.
A complete street gives each group a safe, comfortable place. That usually means continuous sidewalks, safe crossings at short intervals, bike lanes physically separated from fast traffic, bus stops with shelters, street trees and lighting. Designers also use narrower lanes, curb extensions (bulb-outs that shorten the crossing distance), raised crosswalks and single-lane roundabouts to slow vehicles without making the street harder to use.
Speed: the variable that matters most
A pedestrian struck by a vehicle faces dramatically different odds depending on speed. In a widely cited analysis of US crash data (Tefft, 2013), the chance of severe injury was about 10 percent at roughly 26 kilometers per hour, about 50 percent at 50 kilometers per hour, and about 90 percent at roughly 74 kilometers per hour. The exact numbers vary by study and by vehicle type, but the pattern is consistent: risk climbs steeply as speed increases, because the energy of a collision grows with the square of speed. That is why many cities lower urban speed limits to 30 kilometers per hour (about 20 miles per hour) near homes and schools, and why designers shape streets so that drivers naturally slow down, instead of relying on signs alone.
Designing for everyone
An idea popularized by the advocate Gil Peñalosa is 8-80 cities: if a street works for an 8-year-old and an 80-year-old, it probably works for everyone. This test pushes designers to think about curb ramps for wheelchairs and strollers, crossing times long enough for slower walkers, tactile paving for people with low vision, benches for rest and shade for hot days. Accessibility is not an extra; it is part of the basic definition of public space.
Common misconceptions
"Wider roads are always safer." Wide lanes often encourage higher speeds, and crossing distances are longer for people on foot.
"Pedestrian streets hurt shops." Studies of many pedestrianized streets and bike-lane projects find that visitors who walk or cycle often shop more frequently, though they may spend less per trip. Results vary by place, and projects work best with local business involvement.
"Human scale means small and old-fashioned." It means designed with human size and speed in mind, which can be done in dense, modern buildings.
Try it
Build your own street. You have 20 meters between buildings. Allocate the width, and the widget will give feedback on common design rules. It is a teaching tool based on typical guidelines, not an engineering design.
Now look at walking time and the risk curve.
Press Run (or Ctrl + Enter) to see the result here.
Program input · what you'd type while the program runs
Type the answers before you press Run, one per line. Each time the program reads a line (with input()), it gets the next line from this box.
Check your understanding
Quick check · 5 questions
of 5 answered You scored / 5 · perfect!
-
1. What is Jane Jacobs's 'eyes on the street' idea?
Jacobs argued that constant natural surveillance from residents and shops keeps streets safe. -
2. What did William Whyte's plaza studies find?
Simple comforts and choice drew crowds. -
3. A typical adult walks about 1.4 m/s. How long does 700 m take?
700 / 1.4 = 500 seconds, which is about 8.3 minutes. -
4. Why is speed the most important street safety variable?
Kinetic energy grows with the square of speed, and injury risk rises quickly. -
5. What is a complete street?
It gives safe space to walkers, cyclists, transit riders and drivers.
Summary
- Jacobs, Gehl and Whyte shifted attention from traffic flow to how people use streets.
- Human scale fits walking speed, eye level and the distance at which we recognize faces.
- A cross-section is a budget: every meter has a trade-off.
- Complete streets serve all users; the 8-80 test checks them.
- Lower speeds greatly reduce injury risk.
Next: Parks and green networks
Track your progress
Create a free account to tick off lessons and pick up where you left off on any device.
of Urban Planning lessons completed