


















Lesson 25 of 43 · Housing and Equity
Chapter 5 review: Housing and equity
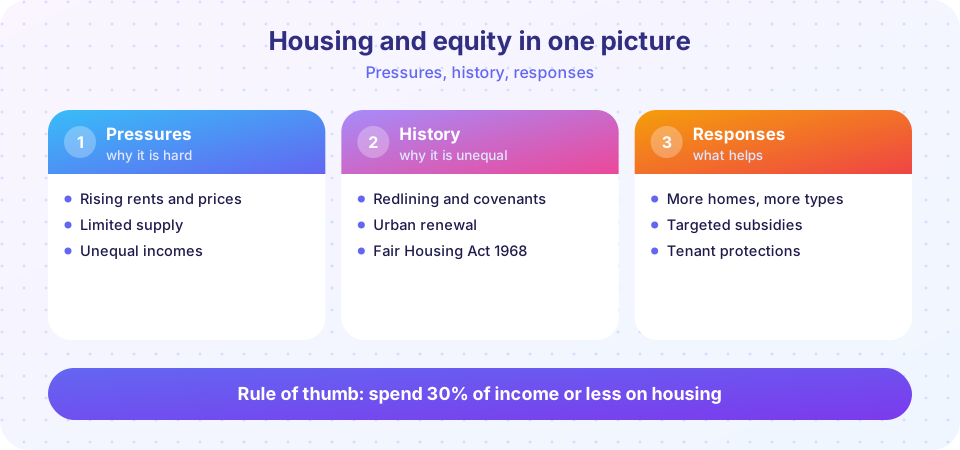
Review chapter 5 with a one-picture summary, a recap table of affordability, segregation and policy tools, and a ten-question quiz mixing all the lessons.
You have now covered the hardest chapter for many learners, because housing mixes arithmetic, history and values. This review pulls the pieces together. Read the picture first, scan the table, then test yourself with the quiz. If a question feels shaky, go back to the lesson named in the table.
The chapter in one table
| Idea | What to remember | Lesson |
|---|---|---|
| Cost burden | Over 30% of income on housing; over 50% is severe | Affordability |
| AMI | Programs set rents from percentages of area median income | Affordability |
| Market limits | Fixed location, slow supply and regulation | Affordability |
| Redlining | 1930s lending maps graded neighborhoods A to D | Segregation |
| Legal milestones | Shelley v. Kraemer 1948; Fair Housing Act 1968 | Segregation |
| Dissimilarity index | 0 is even, 1 is fully separated | Segregation |
| Schelling model | Mild preferences can cluster a city | Segregation |
| Supply tools | Upzoning, ADUs, fewer barriers | Policy tools |
| Subsidy tools | Vouchers, tax credits, social housing | Policy tools |
| Land and protection tools | Land trusts, value capture, rent rules | Policy tools |
How the three lessons connect
Think of the chapter as a chain of reasoning. First, the numbers: a household is burdened when housing eats too much of its income, and a market with slow, regulated supply makes burdens likely when demand rises. Second, the history: those burdens do not fall at random, because past decisions about lending, deeds and renewal concentrated both opportunity and disadvantage in particular places. Third, the response: no single policy fixes both the numbers and the history, so cities combine tools that add homes, help households pay, protect tenants and keep subsidized homes affordable.
When you meet a housing proposal in the news, ask three questions. Does it add homes, lower costs, or protect people? Who gains and who bears the cost? And what does the evidence from similar places say about how long the results take?
Common mistakes to avoid on a test
Learners most often slip in a few predictable places. Check yourself against this list before an exam or a discussion.
- Forgetting to convert units of time. Annual income and monthly rent are not comparable until you divide by twelve (or multiply by twelve). Always write the unit next to every number.
- Mixing up AMI and the household's own income. An affordable-housing program might say a unit is for households at 60 percent of AMI. That means the cap is set from the area median, not from the actual family's earnings, and the exact limit also depends on household size.
- Treating the 30 percent rule as a law. It is a guideline with known limits, and some households can live comfortably above it while others struggle below it.
- Blaming one cause. Segregation, rising prices and shortages each have several causes, including policy, markets and history. Be careful with words like "only" and "always."
- Confusing the tools. Vouchers help households pay rent in private buildings, social housing is owned by a public or non-profit body, and inclusionary zoning requires affordable units inside new private buildings.
A sample reasoning chain
Suppose a city reports that rents have risen faster than incomes for ten years and that many low-income households spend more than half of their income on housing. A strong answer to "what should the city do?" has four parts: name the problem with numbers (the cost-burden share), explain likely causes (limited supply near jobs, rising land costs, a history of exclusionary rules), propose a mix of tools (upzoning and permitting reform for supply, vouchers or subsidies for the lowest incomes, tenant protections while supply grows) and state what you would measure afterward (new homes permitted, the burden share, displacement). Practicing this four-part structure will help you in the quiz below and in real debates.
Check your understanding
Quick check · 10 questions
of 10 answered You scored / 10 · perfect!
-
1. A household with income 2,500 per month pays 1,375 for housing. What is the cost burden share?
1,375 / 2,500 = 0.55, so 55%, which is severely cost-burdened (over 50%). -
2. At 50% of an AMI of 72,000, what monthly housing cost is affordable under the 30% rule?
50% of 72,000 is 36,000. 30% of that is 10,800 per year, or 900 per month. -
3. Why is housing supply slow to respond to rising demand?
Location, time and regulation slow the supply response. -
4. What were the HOLC maps?
They graded neighborhoods by perceived lending risk in the 1930s. -
5. Which pair is correctly matched?
The Fair Housing Act is 1968; urban renewal was the Housing Act of 1949; the Group Areas Act is South African. -
6. In two tracts with the same overall groups, which pattern has the larger dissimilarity index?
Separation increases D; equal mixes give D = 0. -
7. What does the Schelling model illustrate?
Even modest preferences can produce large clusters, though the model ignores real-world constraints. -
8. Which tool keeps a subsidized home affordable across resales?
The trust retains the land and limits resale prices. -
9. Which statement about vouchers is accurate?
Vouchers help households pay rent in private-market homes. -
10. A good planner facing a housing debate should
Clear thinking separates facts from values and uses a mix of tools.
Summary
- Housing burden is measured against income; markets adjust slowly.
- Past lending and legal practices shaped today's patterns.
- Cities have supply, subsidy, land and protection tools, usually used together.
- Evaluate every proposal by what it adds, who benefits and what the evidence says.
Track your progress
Create a free account to tick off lessons and pick up where you left off on any device.
of Urban Planning lessons completed