


















Lesson 4 of 43 · Getting Started
Reading a City: Form, Fabric and Image
Learn to read a place like a planner: street patterns, block size, connectivity measures, figure-ground maps and Kevin Lynch's five elements of the city image.
Walk through two neighborhoods and you can feel the difference before you can explain it. In one, you can wander in any direction and always find another route. In the other, every street curves off a single road and you must double back to get anywhere. Planners train themselves to see the causes of that feeling in the plan of a place: its street pattern, the size of its blocks, the shape of its open spaces and the landmarks people use to find their way.
This lesson gives you a set of reading skills. You will learn to describe an urban fabric, measure how connected it is with simple numbers, and use the vocabulary of Kevin Lynch, whose studies of how people mentally map cities remain a classic.
What you will learn
- The main street patterns and what each one does to walking and driving.
- How block size and connectivity can be measured with simple numbers.
- What a figure-ground map shows and how to read one.
- The five elements in Kevin Lynch's image of the city.
- How planners observe real behavior, not only maps.
Key terms
Urban fabric: the physical pattern of streets, blocks, plots and buildings in an area.
Block: an area of land bounded by streets.
Connectivity: how many direct routes link places; high connectivity means more choice and shorter trips.
Intersection density: the number of street intersections per square kilometer.
Figure-ground map: a map that shows buildings as solid shapes and everything else as empty space, revealing the pattern of built and open space.
Street patterns
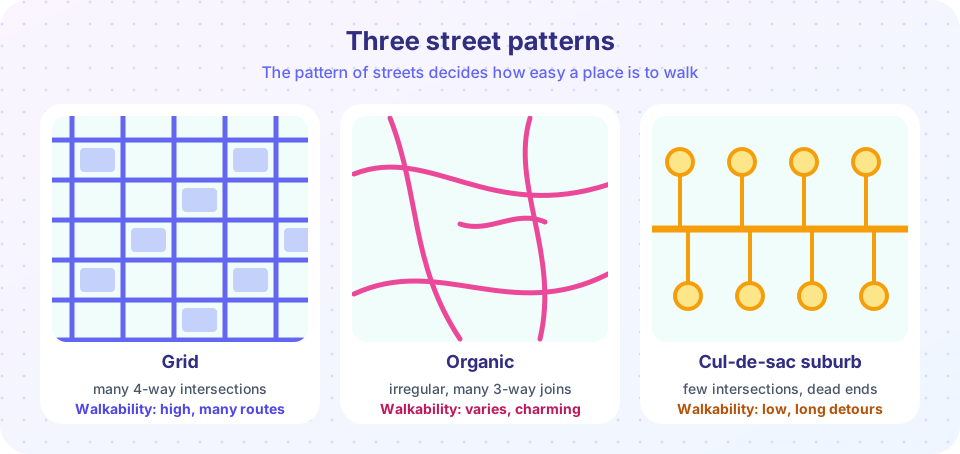
A grid has straight streets crossing at right angles. Grids are easy to survey, easy to divide into lots and offer many alternative routes, which spreads traffic and shortens walking distances. Many old and planned cities use them: Barcelona's nineteenth-century Eixample, much of Manhattan and the downtowns of countless American and Latin American towns. A weakness of a pure grid is monotony and the lack of a clear center unless the plan adds squares and diagonals.
An organic pattern grew without an overall plan, following hills, rivers and old footpaths. The streets curve, vary in width and often meet in three-way junctions. Medieval town centers and old Mediterranean towns are good examples. They tend to be charming, intimate and slow for vehicles, though they can be confusing for visitors and hard to serve with large vehicles or modern utilities.
A hierarchical or cul-de-sac suburb is the typical pattern of many post-1945 suburbs. Short, looping local streets and dead ends feed into a few collector roads and then arterials. This keeps through traffic off local streets, which feels quiet and safe. The cost is connectivity: homes that are close as the crow flies may be far apart by road, walking and cycling trips become long detours, and all car trips must funnel through a few busy roads.
Of course these are ideal types. Real places mix them, and the details matter as much as the labels.
Block size and why it matters
The block is the basic unit of the urban fabric. Shorter blocks mean more intersections and more route choices. A grid with 100-meter blocks has about four times as many intersections per square kilometer as a grid with 200-meter blocks, because the number of intersections grows with the square of the number of streets. Very large blocks of 400 meters or more produce long straight stretches, few crossings and a pedestrian experience dominated by the street edge.
For a quick estimate, take a square grid with a block length of L meters. In one square kilometer there are about (1000 / L)² intersections. For L = 100 that is about 100 intersections per square kilometer; for L = 200 it is about 25; for L = 300 it is about 11. Planners and public-health researchers use intersection density as a simple proxy for how walkable a place is, with many studies finding that places with higher intersection density see more walking, though other factors such as land use and safety also matter.
Measuring connectivity
You can describe a street network as a graph: nodes are intersections and dead ends, links are the street segments between them. Two simple numbers summarize connectivity.
- Link-node ratio = number of links ÷ number of nodes. A tree with no loops has a ratio below 1. A perfect grid approaches 2 as it grows. Planners often aim for around 1.4 or higher as a sign of a reasonably well-connected network.
- Dead-end share = dead-end nodes ÷ all nodes. A high share means many cul-de-sacs.
These measures are crude but useful, and you will compute them yourself in the first Try it example below.
Figure-ground: seeing the shape of space
A figure-ground map colors buildings black and everything else white. It strips away labels and function and shows the structure of built mass and open space. In a traditional city center, the white space forms a connected system of streets and squares carved out of dense building; the space has clear edges and shape. In a modernist or suburban area, buildings often appear as separate objects floating in a continuous white field, and the space between them has no clear form.
The figure-ground idea was made famous by the eighteenth-century Nolli map of Rome (1748), which showed public interiors such as churches as open space along with streets and squares. It remains a powerful way to compare cities: lay the figure-ground of two districts side by side and the difference in character is immediately visible.
Lynch's image of the city
In the late 1950s the American planner Kevin Lynch asked residents of Boston, Jersey City and Los Angeles to draw maps of their cities and to describe routes. In The Image of the City (1960) he reported that people organize their mental maps with five types of element. A city is easy to "read," Lynch said, when these elements are clear and legible.
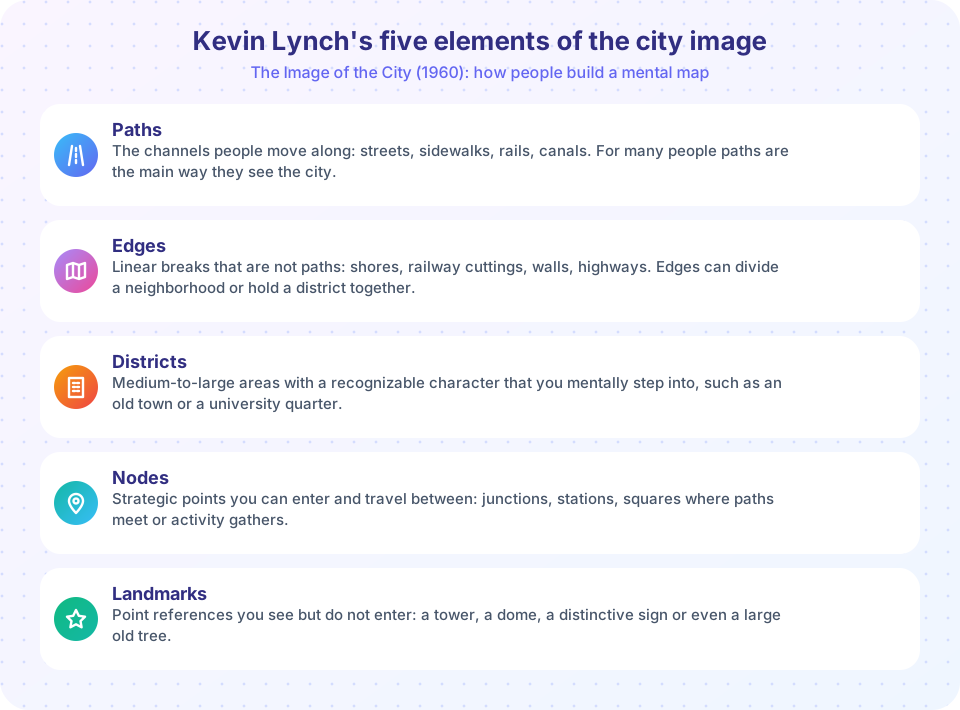
The idea of legibility is the key. A legible city is one whose parts are easy to recognize and connect into a whole pattern. Illegible places, with similar-looking streets and no landmarks, make people feel lost and anxious. Lynch also noted that different people can emphasize different elements: some rely mainly on paths, others on landmarks.
His method has limits. The interviews involved relatively small samples in three American cities, and later researchers pointed out that people of different ages, cultures and incomes read cities differently. Still, the five elements are a practical checklist: when you visit a place, try to identify its paths, edges, districts, nodes and landmarks, and notice where one is missing or confusing.
Watching people, not just plans
Maps show potential; people show reality. The urbanist William H. Whyte led the Street Life Project in New York in the 1970s, filming plazas and counting how people used them. His book The Social Life of Small Urban Spaces (1980) reported, among other findings, that people tend to sit where there are places to sit, that movable chairs and food vendors attract activity, and that spaces visible from the street are used more. You can repeat his approach: choose a space, count how many people pass or stay at set times, and note what they do. Chapter 6 develops these methods.
Common misconceptions
"A grid is always the best pattern." Grids give connectivity, but a grid of very wide, fast roads can be unpleasant and unsafe. The width, speed and design of the streets matter as much as the pattern.
"Cul-de-sacs are bad everywhere." They calm traffic and are valued by many residents. The problem arises when a whole district has only cul-de-sacs, forcing every trip onto a few arterials. A common compromise is to add walking and cycling links through the ends of dead-end streets.
"Walkability is just about sidewalks." Connectivity, land use, safety, shade and comfort all play a role.
Try it
Let us compute the link-node ratio and dead-end share for three tiny street networks. Each network is a list of links between intersections. The numbers are for these small examples, not for real cities.
Press Run (or Ctrl + Enter) to see the result here.
Program input · what you'd type while the program runs
Type the answers before you press Run, one per line. Each time the program reads a line (with input()), it gets the next line from this box.
The next widget shows how block length changes intersection density, and how far you must walk for a trip to a point three blocks away.
Check your understanding
Quick check · 5 questions
of 5 answered You scored / 5 · perfect!
-
1. A square grid has 200 m blocks. About how many intersections per square kilometer does it have?
Intersections per km2 are about (1000 / 200) squared = 5 squared = 25. -
2. Which pattern typically has the lowest connectivity?
Dead ends and looping streets feeding a few collector roads force long detours and funnel traffic onto few routes. -
3. In a figure-ground map, what is shown in black?
Buildings are the solid 'figure'; the open space around them is the 'ground'. -
4. Which of Lynch's elements is a point you can see but do not enter, such as a tower?
Landmarks are point references. Nodes are points you can enter, such as junctions or squares. -
5. A link-node ratio below 1 means the network is:
A tree with n nodes has n-1 links, so its ratio is below 1. Loops add links and raise the ratio.
Summary
- Street pattern, block size and connectivity shape how easily people can walk, cycle and drive.
- Intersection density and link-node ratio are simple, imperfect measures of connectivity.
- Figure-ground maps reveal the structure of built and open space.
- Lynch's five elements, paths, edges, districts, nodes and landmarks, describe how people form mental maps of a city.
- Observing real behavior, as William Whyte did, complements maps and numbers.
Next: Chapter 1 Review
Track your progress
Create a free account to tick off lessons and pick up where you left off on any device.
of Urban Planning lessons completed