


















Lesson 33 of 43 · Sustainability and Resilience
Chapter 7 review: Sustainability and resilience
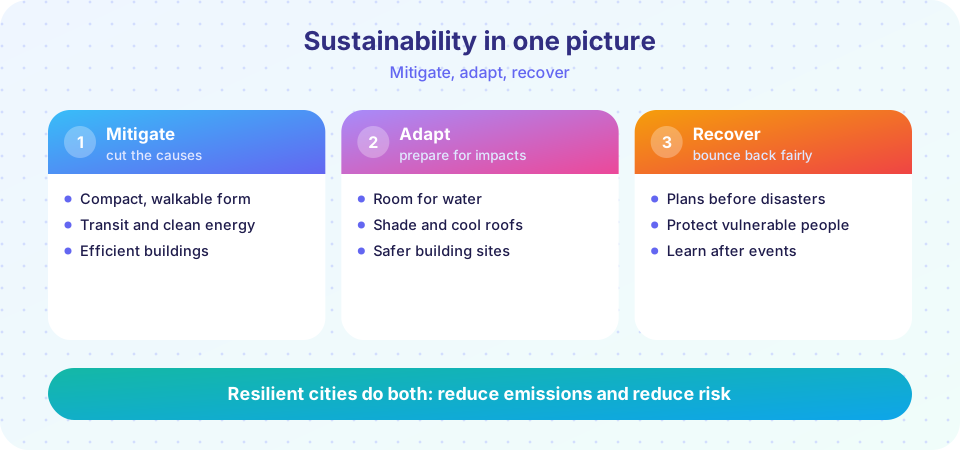
Review chapter 7 with a one-picture summary, a recap table of mitigation and adaptation ideas, and a ten-question quiz on urban form, flood risk and runoff.
A resilient city does two jobs at once: it works to limit climate change, and it prepares its people and places for the changes that cannot be avoided. This review links the two lessons so you can see that the same planning tools, such as compact neighborhoods, trees and well-designed streets, often serve both goals.
The chapter in one table
| Idea | What to remember | Lesson |
|---|---|---|
| Emission sources | Buildings and transport dominate most city inventories | Climate and urban form |
| Five Ds | Density, diversity, design, destinations, distance to transit | Climate and urban form |
| TOD and 15-minute city | Daily needs close by; targets, not rigid rules | Climate and urban form |
| Embodied carbon | Emissions from making materials; reuse helps | Climate and urban form |
| Risk | Hazard x exposure x vulnerability | Hazards and adaptation |
| Annual chance | 100-year flood = 1% per year; P = 1 - (1 - p)^n | Hazards and adaptation |
| Runoff | Q = C x i x A / 360; paving raises C | Hazards and adaptation |
| Adaptation | Protect, accommodate, retreat; nature-based options | Hazards and adaptation |
| Equity | Vulnerable people need warnings and investment first | Hazards and adaptation |
Connecting the ideas
Notice how often one measure serves several goals. A street tree shades a sidewalk (adaptation to heat), absorbs a little stormwater (adaptation to floods), makes walking more pleasant (supporting low-carbon travel) and lowers cooling demand (mitigation). Planners call this a co-benefit, and co-benefits are a strong argument when budgets are tight. In contrast, some measures help one goal and hurt another: a sea wall may protect a neighborhood but cut off access to the shore, and a new highway interchange may speed driving while raising emissions. Evaluating options against several goals avoids those traps.
Common mistakes to avoid
- Confusing mitigation with adaptation. Insulating a building so it burns less fuel is mitigation. Adding a flood barrier is adaptation. Planting trees can serve both, which is why it is such a popular measure.
- Reading "100-year" as a schedule. The label describes a 1 percent chance each year, so two such floods in a decade are unlikely but possible.
- Mixing units in the rational method. Rainfall intensity must be in millimeters per hour and area in hectares for the formula with 360 in the denominator. Another unit system needs a different constant.
- Assuming density alone lowers emissions. The evidence points to a combination of density, mixed uses, good design and transit, and income and preferences also matter.
- Ignoring who is harmed. A plan that protects property values but leaves out the households with the fewest resources has not delivered resilience.
A sample reasoning chain
Imagine a coastal neighborhood that floods during storms and runs hot in summer. A good response begins with a risk map that overlays flood zones, heat exposure and social vulnerability. It then proposes a mix of measures: set back or raise buildings where flooding is frequent, add street trees and shaded stops to cool the streets, create a park that can store stormwater, and arrange evacuation support for residents without cars. It budgets for maintenance, sets indicators such as canopy cover and the number of homes in the flood zone, and promises a review after each major event. Notice how the answer links physical measures to people and to monitoring.
Check your understanding
Quick check · 10 questions
of 10 answered You scored / 10 · perfect!
-
1. Which pair makes up most urban emissions in many cities?
Energy in buildings and in moving people and goods dominate inventories. -
2. What do the 'five Ds' describe?
Together they influence how much people drive. -
3. What does mitigation mean?
Mitigation addresses causes; adaptation addresses impacts. -
4. A 50-year flood has what annual chance?
1/50 = 0.02, which is 2% per year. -
5. What is the chance of at least one 2% annual-chance flood in 10 years? (1 - 0.98^10)
0.98^10 is about 0.817, so 1 - 0.817 is about 0.18. -
6. What is Q (m3/s) if C = 0.8, i = 45 mm/h, A = 20 ha?
0.8 x 45 x 20 = 720; 720 / 360 = 2 m3/s. -
7. Which is a retreat strategy?
Retreat moves people and assets away from the hazard. -
8. What is a co-benefit?
Street trees, for example, support both cooling and walking. -
9. Why might historical flood maps understate risk?
Climate change is changing the odds, so maps need updating. -
10. Which approach best addresses vulnerability?
Targeting follows from the fact that harm is unequal.
Summary
- Cities cut emissions mainly through buildings and transport choices shaped by urban form.
- Annual-chance language and the rational method turn flood risk into numbers.
- Adaptation, nature-based solutions and equity-focused planning reduce harm.
- Co-benefits make measures that serve several goals especially valuable.
Track your progress
Create a free account to tick off lessons and pick up where you left off on any device.
of Urban Planning lessons completed