


















Lesson 28 of 43 · Public Space and Design
Parks and green networks
Learn how planners measure access to parks, why urban trees cool neighborhoods, what the 3-30-300 rule says, and how green networks beat isolated parks.
A park is more than a patch of grass. It cleans the air a little, soaks up rain, shades hot pavement, gives children a place to play and gives adults a place to rest. But a park far from home is almost no park at all: if you cannot reach it easily, you will not use it. That is why modern planners ask two questions together: how much green space does a city have, and who can reach it on foot?
This lesson covers the history of the planned park, the ways planners measure access, the role of trees in keeping cities cool, and the idea of a green network that links parks, streets, rivers and yards into one system.
What you will learn
- Describe the origins of the planned urban park.
- Explain walkshed analysis and the 10-minute-walk target.
- Describe the benefits of urban trees and green space.
- State the 3-30-300 rule and apply it to examples.
- Explain why green networks work better than isolated parks.
Key terms
Walkshed: the area reachable on foot within a set time or distance.
Tree canopy: the layer of leaves, branches and stems that covers the ground when seen from above, usually given as a percentage of land area.
Urban heat island: the effect that makes built-up areas warmer than their surroundings, caused by dark surfaces, few plants and waste heat.
Green infrastructure: natural and semi-natural features such as street trees, rain gardens and wetlands that provide services like shade and stormwater management.
Green network: connected parks, corridors and green streets that form a system.
From grand parks to everyday green
The idea of a planned park for everyone is relatively young. In 1858 the designers Frederick Law Olmsted and Calvert Vaux won the competition to design Central Park in New York with their Greensward Plan, a large, carefully shaped landscape in the middle of a growing city. Olmsted believed parks were a democratic institution, a place where people from all classes would share fresh air. Later, in Boston, he designed a chain of parks and waterways known as the Emerald Necklace, an early example of linking green spaces into a network instead of building separate islands.
Not all early parks served everyone, and many neighborhoods were left out. Parks designed for wealthy districts, segregated recreation facilities and the demolition of communities to make way for parks all form part of the history, and recent research confirms that neighborhoods with lower incomes and more residents of color have often had less tree cover and fewer parks nearby. This ties directly to the equity themes in the housing chapter.
Measuring access: the walkshed
A common way to evaluate access is the walkshed: draw the area around each park that people can walk to in a set time. A typical adult walks about 80 meters per minute, so a 10-minute walk is roughly 800 meters (about half a mile). Many cities and organizations, including the Trust for Public Land in the United States, use a 10-minute walk to a park as a target. Planners count the share of residents who live inside a park's walkshed and map the gaps.
Real walksheds follow streets, not straight lines. A park across a freeway or a river may be 300 meters away as the crow flies but 2 kilometers by the nearest crossing. Good analysis therefore uses a street network instead of a simple circle, and also asks about quality: the size of the park, its safety, whether it has shade, seating and facilities, and whether people with disabilities can use it. A tiny strip of lawn does not give the same benefits as a 5-hectare park.
For European cities, the World Health Organization regional office has recommended that people have access to public green space of at least half a hectare within about 300 meters of home. You may also see a figure of 9 square meters of green space per resident attributed to the WHO; that number is widely repeated but is not an official guideline, so check where a statistic comes from before you rely on it.
What trees and green space do
Plants cool cities in two ways: they shade surfaces that would otherwise absorb the sun, and they evaporate water from their leaves. On hot days, a tree-lined street can be several degrees Celsius cooler than a bare one, and the surface of a shaded sidewalk can be far cooler than one in direct sun. Trees and green roofs also reduce stormwater runoff, filter some air pollutants, reduce noise, and support birds and insects. Studies link regular contact with green space to better mental health, more physical activity and, in several large studies, lower rates of some illnesses, though researchers are still working out how much of the link is causal and how much reflects other differences between neighborhoods.
Trees need space: roots, soil volume and water. A street tree in a small pit of compacted soil may live only a few years, which is why street design and tree health are connected topics. Planners who want a 30 percent canopy have to protect underground space as well as sidewalk space.
The 3-30-300 rule
The Dutch forestry researcher Cecil Konijnendijk proposed an easy-to-remember guide for urban greening:
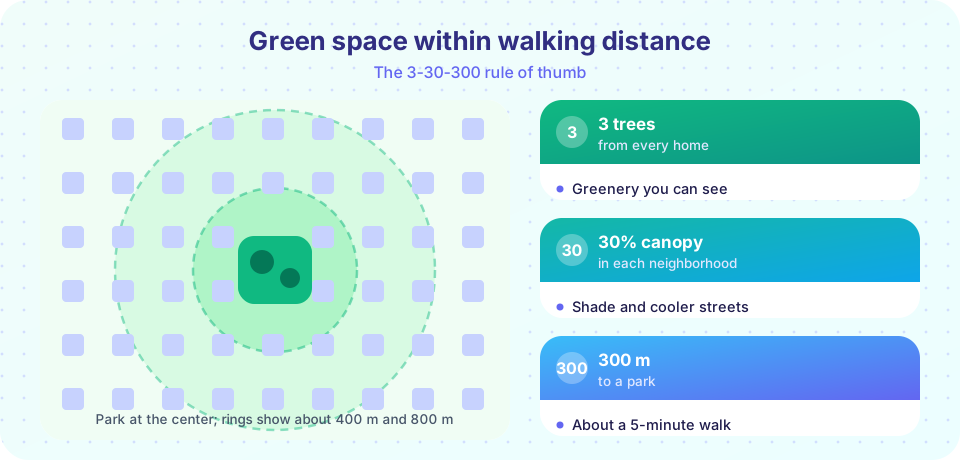
- 3: every person should be able to see at least three trees from their home.
- 30: every neighborhood should have at least 30 percent tree canopy.
- 300: every person should live within 300 meters of a quality green space.
The rule is deliberately simple, and it is a guide rather than a law. Dense city centers and dry-climate cities may find 30 percent canopy hard to reach, and a very small neighborhood might be dominated by a single large park. Even so, the three numbers give planners a shared language for comparing neighborhoods and setting targets.
Green networks and green streets
An isolated park serves its immediate neighbors, but a network links places so that people and wildlife can move between them. Green corridors along rivers, abandoned railways and streets allow cyclists and walkers to travel mostly through greenery, and let animals and plants move across the city. Elements of a network include:
- Large anchor parks that offer play fields, forests or lakes.
- Small neighborhood parks and pocket parks within walking distance of homes.
- Green streets lined with trees, planting strips and rain gardens.
- Corridors along waterways, rail lines and utility routes.
- Private greenery such as yards, courtyards and green roofs, which count too.
Famous examples include Seoul's removal of an elevated highway to uncover the Cheonggyecheon stream, which became a public park through the center of the city in 2005; Singapore's long-term "city in a garden" approach; and the greenways of cities like Portland and Copenhagen. Each project mixed ecology, recreation and transport.
Common misconceptions
"More green space always means a greener city." Where the green space sits matters. A large park at the edge of town helps far fewer people than small parks spread through neighborhoods.
"Planting trees is a quick fix." Trees take years to grow, need water and soil, and require maintenance. Survival rates depend on care after planting.
"Parks make neighborhoods fairer automatically." New parks can raise nearby housing costs and displace residents, a pattern called green gentrification, so some cities pair park investments with housing protections.
Try it
Use this checker to see whether a neighborhood meets the 3-30-300 targets. The numbers you enter are your own; the widget only compares them with the rule's thresholds.
Next, compute a walkshed share for a made-up neighborhood with Python. The homes and parks are random points, so this demonstrates the method rather than describing a real city.
Press Run (or Ctrl + Enter) to see the result here.
Program input · what you'd type while the program runs
Type the answers before you press Run, one per line. Each time the program reads a line (with input()), it gets the next line from this box.
Check your understanding
Quick check · 5 questions
of 5 answered You scored / 5 · perfect!
-
1. What is a walkshed?
A walkshed maps where people can get to on foot. -
2. About how far is a 10-minute walk at 80 m per minute?
10 minutes times 80 m per minute is 800 m. -
3. What are the three numbers in the 3-30-300 rule?
The rule combines visibility, canopy cover and proximity. -
4. Why can an isolated park serve fewer people than a green network?
Connected green corridors extend benefits across neighborhoods. -
5. What is green gentrification?
Park investments can raise nearby property values and push out lower-income residents.
Summary
- Planned parks grew from the nineteenth century; early examples did not serve everyone equally.
- Walksheds measure who can reach green space; a 10-minute walk is about 800 m.
- Trees cool streets through shade and evaporation and support health, but they need space and care.
- The 3-30-300 rule gives simple targets for sight, canopy and distance.
- Green networks connect parks, streets and corridors; pair new parks with equity policies.
Next: Chapter review
Track your progress
Create a free account to tick off lessons and pick up where you left off on any device.
of Urban Planning lessons completed