


















Lesson 25 of 43 · Risk Theory and Loss Models
Risk Theory and Loss Models: Chapter Overview
Get the map of risk theory: how claim counts and claim sizes combine into aggregate losses, and how deductibles and reinsurance reshape them.
Life insurance questions ask when a payment happens. General insurance and risk theory ask a different pair: how many claims will arrive, and how large will each be? A car-insurance company does not know whether you will crash next year, nor whether the bill will be 400 or 40,000. This chapter gives you the standard model for that double uncertainty and the tools to control it.
You will see that the whole subject rests on a small idea: split the total claim cost into a frequency part and a severity part, model each separately, then add them up. Once the total is modelled, deductibles, limits and reinsurance are simply functions applied to the pieces.
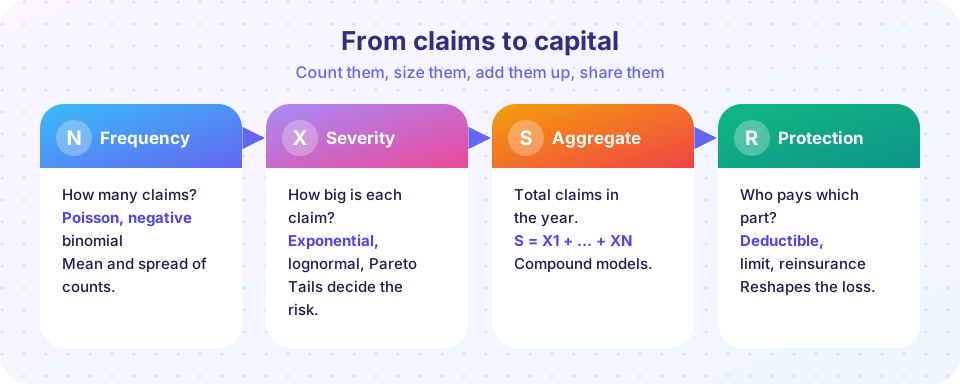
What you will learn
- The collective risk model
S = X₁ + X₂ + … + X_N. - Which distributions are the workhorses for counts and for sizes.
- Why heavy tails and overdispersion change how much capital an insurer needs.
- How deductibles, limits and reinsurance move risk between parties.
Key terms
Frequency: the number of claims N in a period.
Severity: the size X of one claim.
Aggregate loss S: the total of all claims in the period.
Retention: the part of a loss the insurer keeps.
Reinsurance: insurance bought by an insurer to pass on part of its risk.
The big picture
Consider a motor portfolio of 5,000 policies. Over a year, a handful of policies produce no claim, many produce one, a few produce two or more. The number of claims N is random. Each claim is also random: most are small dents and scratches but a few are major accidents. The total S is the sum of a random number of random amounts.
Three facts shape everything that follows.
- The mean is easy, the spread is hard.
E[S] = E[N]·E[X]is simple, but how farScan stray from its mean decides the premium loading and the capital. - Tails matter more than means. A rare very large claim can cost more than all the small claims together. Severity distributions with heavy tails (Pareto, lognormal with large
σ) behave very differently from light tails (exponential). - Risk can be shared. A deductible shifts small claims to the policyholder, a policy limit caps the insurer's maximum, and reinsurance transfers part of the insurer's own risk to another company.
Count, size, add
Frequency models
Severity models
Sharing the risk
What each lesson covers
| Lesson | What you will be able to do |
|---|---|
| Frequency and severity models | Choose and fit counts and sizes, and read their tails. |
| Aggregate claims and compound models | Compute the mean, variance and distribution of the total, and price risk. |
| Deductibles, limits and reinsurance | Value a contract with a deductible and a limit and design a reinsurance treaty. |
| Chapter review | One picture and ten mixed questions. |
Try it
The first TryIt simulates one year of a small motor portfolio. All figures are invented for the example: 2,000 policies, each with an average of 0.1 claims a year and lognormal claim sizes.
Press Run (or Ctrl + Enter) to see the result here.
Program input · what you'd type while the program runs
Type the answers before you press Run, one per line. Each time the program reads a line (with input()), it gets the next line from this box.
Press Run (or Ctrl + Enter) to see the result here.
Program input · what you'd type while the program runs
Type the answers before you press Run, one per line. Each time the program reads a line (with input()), it gets the next line from this box.
Common misconceptions
"The expected total tells you how much capital to hold." Two portfolios with the same mean can have very different spreads; capital depends on the tail of S.
"More data always removes risk." Pooling reduces the relative variability of independent risks but never the systematic part, for example a wrong assumption on inflation.
Check your understanding
Quick check · 4 questions
of 4 answered You scored / 4 · perfect!
-
1. In the collective risk model, S stands for
S is the sum of the N individual claim amounts. -
2. Which severity distribution has the heaviest tail?
A Pareto survival function decays like a power, much more slowly than an exponential. -
3. Which is a reason for an insurer to buy reinsurance?
Reinsurance transfers part of large losses to the reinsurer. -
4. The expected aggregate claims E[S] equal
Wald's identity: with independent claims, E[S] = E[N]·E[X].
Summary
- Risk theory models total claims as a random sum: frequency times severity.
- Spread and tail, not the mean, decide capital.
- Deductibles, limits and reinsurance reshape the loss between policyholder, insurer and reinsurer.
Track your progress
Create a free account to tick off lessons and pick up where you left off on any device.
of Actuarial Mathematics lessons completed