


















Lesson 4 of 46 · Getting Started
Reading the evidence
Learn to tell strong evidence from weak: correlation versus causation, experiments, effect sizes, small-study noise, publication bias and why replication matters.
Open any news site and you will find a headline like "Study shows that [habit] improves [skill]". Sometimes the study is excellent. Sometimes it is a survey of 30 people, or a result that has never been repeated, or an effect so small that nobody would notice it. Learning science is full of strong claims, and not all of them are equally trustworthy.
You do not need advanced mathematics to read evidence sensibly. You need a handful of questions to ask, a feel for how big a "real" effect is, and the habit of preferring findings that have been confirmed more than once. This lesson gives you all three, with a model you can play with.
What you will learn
- The difference between correlation and causation, and how an experiment separates them.
- What an effect size tells you that a p-value does not.
- Why small studies are noisy and how publication bias distorts what you read.
- A short checklist for judging any claim about learning.
Key terms
Correlation: a statistical relationship between two variables, such as hours studied and exam score.
Randomized controlled trial (RCT): an experiment in which chance assigns participants to conditions.
Effect size: a measure of how large a difference or relationship is, for example Cohen's d in standard deviation units.
Confounder: a third factor that influences both variables and creates a misleading link.
Meta-analysis: a statistical combination of the results of many studies on the same question.
Correlation is not causation
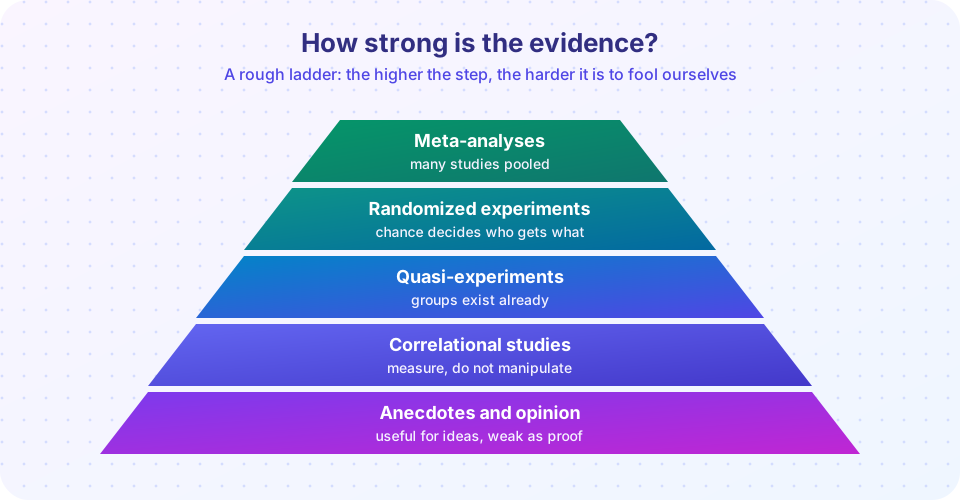
Suppose a survey finds that students who sleep more get higher grades. Does sleep cause better grades? Maybe. But other explanations are just as plausible. Perhaps students who are organized both sleep regularly and study well. Perhaps students in stressful home situations sleep badly and also struggle at school. Perhaps good grades reduce worry, which improves sleep. A hidden third factor that affects both variables is called a confounder.
A correlation is not useless. It is a clue worth following. But on its own, it cannot tell you what would happen if you changed something. For that you need an experiment.
How an experiment tests cause
In a randomized controlled trial, the researcher changes one thing on purpose and compares groups. Imagine you want to know whether self-testing helps. You take 120 students and let a coin flip decide which half practices by self-testing and which half rereads. Because chance, not preference, assigned the groups, the two groups should be similar in motivation, prior knowledge and sleep. If the testing group scores higher on a later exam, the best explanation is the testing itself.
Good experiments share several features:
- Random assignment to conditions.
- A fair control condition (for example restudying, not "nothing").
- The same test and time limits for everyone.
- Ideally, blinding: the person who scores the test does not know who was in which group.
- A delayed test, because, as lesson 2 showed, immediate performance can mislead.
In education research, a true experiment is not always possible. You cannot randomly decide who goes to which school. Quasi-experiments use naturally occurring groups and try to adjust for differences, which is less convincing because unmeasured confounders can remain.
Effect sizes: how big is the difference?
A study can report a "statistically significant" result that is tiny and useless, or a large effect from a sample too small to be significant. The p-value only tells you how surprising the data would be if there were no effect at all. It does not tell you how big the effect is.
An effect size does. A common one is Cohen's d: the difference between two group averages divided by the typical spread (standard deviation) within groups. If the testing group averages 75, the rereading group 70, and the standard deviation is 10, then d = 0.5.
Jacob Cohen suggested rough labels: about 0.2 is small, 0.5 medium and 0.8 large. These are conventions, not laws; what counts as meaningful depends on cost and context. In education, a d of 0.2 across a whole school year can still be valuable if the intervention is cheap. Beware of any single benchmark number that claims to decide whether something "works". John Hattie's well-known "hinge point" of 0.4 has been criticized by statisticians for just this kind of simplification.
You can also ask for a confidence interval: a range of effect sizes that the data are consistent with. A narrow interval around d = 0.5 is far more informative than a wide interval from 0.05 to 1.2.
Why small studies are noisy
Imagine the true effect of a teaching method is small but real: d = 0.3. If you run it with 20 students per group, random variation in which students ended up where will swing your result wildly. Some studies will find d = 0.9, others d = -0.1. If only the exciting ones get published, readers see an exaggerated picture. This is publication bias (also called the file-drawer problem). Small samples also make it easy to find "significant" results by accident, especially when researchers test many outcomes and report only the ones that worked.
Psychology has taken this lesson seriously. After the replication project of 2015 (see the last lesson), many journals encouraged preregistration (stating the plan before collecting data), larger samples, shared data, and registered reports, where a study is accepted for publication before the results are known.
Meta-analysis and big reviews
A meta-analysis pools many studies. Its power is that individual quirks average out. Its weakness is that if the underlying studies are biased, the average is biased too ("garbage in, garbage out"). Good meta-analyses check for publication bias, look at differences between studies, and report how confident they are.
A famous example in learning research is the review by Dunlosky and colleagues (2013) of ten study techniques. They rated each one for how widely it works across learners, materials and tests. Practice testing and distributed practice earned the highest ratings; highlighting, underlining and rereading earned low ones. Notice that this is a judgment about utility across conditions, not a promise that everything rated high will help every student in every situation.
A checklist for any claim about learning
- What was measured, and when? Was there a delayed test?
- Who was compared with whom, and were they randomly assigned?
- How big is the effect, and how certain? Look for an effect size and an interval.
- How many participants? Under about 30 per group, be cautious.
- Has it been replicated, by other teams, in other settings?
- Who gains if you believe it? Companies and consultants have motives; so do researchers who need publications.
- Does it fit what else is known? Extraordinary claims need stronger evidence.
Common misconceptions
"A significant result means a big effect." Significance depends on sample size. A huge study can detect a trivial effect.
"One study proves it." Single studies are noisy. Look for patterns across many.
"Peer reviewed means true." Peer review catches some problems but not all, and replication shows that published results can fail to hold up.
"If experts disagree, nothing can be known." Experts often disagree about fine details while agreeing on a broad core, such as the benefits of retrieval practice and spacing.
Try it
First, a correlation explorer. Drag the slider to set the true relationship strength between two measures, and see how the sample correlation r from 40 random points varies. Then tick the box to add a single extreme point. One outlier can change a correlation dramatically, which is why graphs matter.
Second, a simulation of noisy small studies. A true effect of d = 0.3 is tested thousands of times with 20 and then 200 students per group. See how widely the observed effect sizes spread, and what share reach significance.
Press Run (or Ctrl + Enter) to see the result here.
Program input · what you'd type while the program runs
Type the answers before you press Run, one per line. Each time the program reads a line (with input()), it gets the next line from this box.
Check your understanding
Quick check · 5 questions
of 5 answered You scored / 5 · perfect!
-
1. A survey finds that students who use flashcards get higher grades. Which statement is most justified?
A correlation alone cannot show cause. Motivated students might use flashcards and also study in other effective ways. -
2. What is the main advantage of random assignment?
Chance spreads known and unknown differences evenly across groups, so a difference in outcomes can be attributed to the manipulation. -
3. A teacher scores 75 under method A and 70 under method B, with a standard deviation of 10. What is Cohen's d?
d is the difference in means divided by the standard deviation: (75 - 70) / 10 = 0.5. -
4. Why does publication bias exaggerate effects in the literature?
If exciting results are published and quiet ones stay in the file drawer, the visible evidence overstates the true effect. -
5. In the simulation, what happens when the sample size per group rises from 20 to 200?
Larger samples reduce random noise, so estimates are more precise and a true effect is detected more often.
Summary
- Correlation shows a link; random assignment in an experiment is the best way to test a cause.
- Effect sizes show how big an effect is; p-values do not.
- Small studies are noisy, and publication bias distorts the visible literature.
- Meta-analyses and replications give more reliable pictures than single studies.
- Use a checklist: measurement, comparison, size, sample, replication, motives and fit.
Next: Chapter 1 review
Track your progress
Create a free account to tick off lessons and pick up where you left off on any device.
of The Psychology of Learning lessons completed