


















Lesson 32 of 42 · Sustainable and Precision Agriculture
Precision Agriculture Technology
Learn how GNSS guidance, sensors, NDVI maps and variable-rate machines let farmers manage field variability, and how to judge when the technology pays.
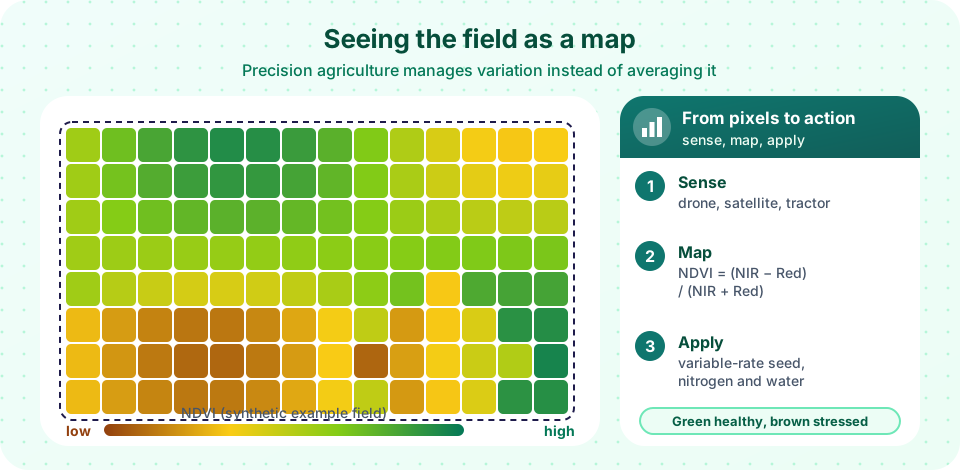
Walk across any field and you will see that it is not uniform. A low corner holds water, a ridge dries out, one patch has sandy soil and another heavy clay. Crops grow differently in each place and need different amounts of seed, nutrients or water. For centuries farmers coped by treating the whole field with an average. Precision agriculture does the opposite: it measures the variation, decides what each part needs and applies it only there.
This works because of three families of technology that arrived in the last forty years: satellite positioning (so a machine knows where it is), sensors and imagery (so it can see what the crop is doing) and computer-controlled machines (so inputs can change on the move). In this lesson you will learn how each one works, make a vegetation map with a formula, and learn how to judge whether the technology pays for a particular farm.
What you will learn
- Describe the measure, decide and apply cycle of precision agriculture
- Explain how satellite positioning accuracy ranges from meters to centimeters
- Calculate NDVI and use it to build management zones
- Compare satellites, drones and ground sensors as data sources
- Judge costs, limits and risks, including smallholder options
Key terms
GNSS: global navigation satellite systems such as GPS, Galileo, GLONASS and BeiDou.
RTK: real-time kinematic correction that gives GNSS positions accurate to about 2 cm.
NDVI: the normalized difference vegetation index, a measure of green plant vigor from satellite or drone images.
Management zone: part of a field with similar yield potential or limiting factors, treated as a unit.
Variable-rate technology (VRT): machines that change seed, fertilizer, chemical or water rates while moving.
The cycle: measure, decide, apply
Precision agriculture is a loop, not a gadget.
- Measure. Collect data: position, yield, soil properties, crop condition, weather.
- Decide. Turn data into maps, zones and prescriptions, using agronomy, models and trials.
- Apply. Machines follow the prescription, then record what was done.
- Measure again. The yield map at harvest is the test of the decisions.
Knowing where you are: GNSS
A receiver calculates its position from the signals of several satellites. A standard receiver is accurate to a few meters. With corrections from a nearby fixed base station or a network (differential GNSS and RTK), accuracy improves to about 2 cm. That is good enough for a tractor to steer itself along the same lines year after year (autosteer), which cuts overlaps and gaps. Sprayers and seeders with section control switch parts of the boom off automatically over areas already covered, and overlap savings of several percent of inputs are commonly reported. Controlled traffic farming uses fixed wheel tracks so only a small part of the field is compacted.
Seeing the crop: sensors and imagery
How NDVI works
Healthy green leaves absorb red light, which chlorophyll uses for photosynthesis, and strongly reflect near-infrared (NIR) light, which is bounced by leaf cell structure. Stressed or sparse vegetation absorbs less red and reflects less NIR. The index uses the contrast:
NDVI = (NIR − Red) / (NIR + Red)
Values range from about −1 to +1. Bare soil sits around 0.1 to 0.2, sparse crop 0.2 to 0.5, and dense, vigorous green vegetation 0.6 to 0.9. Example: if a leaf reflects 45% NIR and 8% red, NDVI = (0.45 − 0.08) / (0.45 + 0.08) = 0.37 / 0.53 ≈ 0.70.
NDVI has limits. It saturates when the canopy is very dense, it is affected by soil color and shadows, and it measures vigor, not the cause of poor vigor: a patch may be pale from nitrogen shortage, waterlogging, disease or compaction. Indices using the "red edge" band (such as NDRE) help in dense canopies.
Where the images come from
| Source | Typical detail | Strengths | Limits |
|---|---|---|---|
| Satellites (e.g. Sentinel-2) | 10 m pixels, revisit every few days | Free, regular, whole regions | Clouds block optical images |
| Drones | Centimeters per pixel | On demand, very detailed | Battery, regulations, labor |
| Tractor or handheld sensors | Plant by plant | Immediate, work under cloud | Must be driven or carried |
| Radar satellites (e.g. Sentinel-1) | 10 m pixels | See through cloud | Harder to interpret |
Other data layers include yield monitors on combines (a map of grain per hectare built from flow sensors and GNSS), soil electrical conductivity sensors (which relate to clay and moisture), soil samples, and field weather stations. In-field IoT probes report soil moisture and temperature continuously and can trigger irrigation.
Deciding: from maps to prescriptions
A single map rarely tells the story. Agronomists combine several layers (several years of yield, soil, imagery, elevation) into management zones, often with clustering software. Each zone gets a prescription: for example, a seed rate, a nitrogen rate or a lime rate. The prescription logic must come from agronomy and local trials. Low vigor in one zone might call for more nitrogen, while in another zone, where the cause is shallow soil, extra nitrogen would only be wasted. Software only multiplies the quality of the thinking behind it.
Applying: variable-rate and robots
Variable-rate seeders, fertilizer spreaders and sprayers read the prescription map and change rates according to GNSS position. Pivots with variable-rate irrigation (VRI) change the water amount by sector. Spot-spraying machines use cameras and image recognition to spray only the weeds instead of the whole field, and trials report large reductions in herbicide use. Autonomous tractors and small field robots are moving from research to commercial use, especially for weeding in vegetables.
Costs, limits and who benefits
- Costs. RTK systems, yield monitors, VRT controllers and subscriptions run into thousands or tens of thousands of dollars. The payback depends on how variable the fields are, how large the farm is and how high input prices are. Highly uniform fields gain little.
- Skills and data. Someone must collect, clean and interpret data; data ownership, privacy and compatibility between brands (standards such as ISOBUS) are real issues.
- Connectivity. Rural broadband and cell coverage can be weak.
- Smallholders. Large machines are not the only route. Free satellite maps, smartphone apps, text-message advisories, shared drone services and index insurance based on satellite data bring part of the benefit to small farms.
- Environmental gain. Applying nitrogen, pesticides and water only where they are needed reduces pollution and costs together, which links directly to the sustainability ideas of this chapter.
Common misconceptions
"A colorful map is a decision." A map shows where the crop differs, not why. Ground-truth with scouting, soil tests and agronomic knowledge before acting.
"Precision agriculture always saves inputs." Sometimes the map says apply more in the productive zones. The gain is better use of inputs, not necessarily less.
"High NDVI means high yield." NDVI correlates with biomass and vigor, but yield also depends on grain filling, disease, heat and many other factors.
Try it
This program creates a synthetic field with smooth patches of vigor, calculates NDVI from simulated red and near-infrared bands, divides the field into three zones and compares a uniform nitrogen rate with a variable-rate plan. Both the data and the rates are invented for teaching, and the zone rule is a simple demonstration, not an agronomic recommendation.
Press Run (or Ctrl + Enter) to see the result here.
Program input · what you'd type while the program runs
Type the answers before you press Run, one per line. Each time the program reads a line (with input()), it gets the next line from this box.
This calculator shows how reflectance values become an NDVI and a rough class. Slide the two reflectances and see what vegetation they imply.
Check your understanding
Quick check · 5 questions
of 5 answered You scored / 5 · perfect!
-
1. NIR reflectance is 50% and red is 10%. What is NDVI?
NDVI = (0.50 - 0.10) / (0.50 + 0.10) = 0.40 / 0.60 = 0.67. -
2. Which positioning method gives about 2 cm accuracy?
RTK uses correction signals from a base station or network to reach centimeter accuracy. -
3. Why can a low-NDVI patch still not justify more nitrogen?
NDVI shows vigor, not cause. Scouting and soil tests tell you why. -
4. Which data source can see the ground through clouds?
Radar satellites such as Sentinel-1 are not blocked by cloud, although their images are harder to interpret. -
5. What is the best description of precision agriculture's goal?
It manages in-field variability so inputs go where they will be used best.
Summary
- Precision agriculture is a loop of measure, decide, apply and measure again.
- GNSS with RTK gives about 2 cm accuracy, enabling autosteer, section control and variable-rate application.
- NDVI = (NIR − Red) / (NIR + Red) maps vigor (about 0.6 to 0.9 is dense green) but not the cause of poor growth.
- Satellites, drones and ground sensors complement each other; management zones turn maps into prescriptions.
- Costs, skills, data issues and farm size decide the payback; low-cost tools help smallholders too.
Track your progress
Create a free account to tick off lessons and pick up where you left off on any device.
of Agricultural Science lessons completed