


















Lesson 3 of 44 · Getting Started
Evidence and Methods in Political Science
How political scientists test claims: surveys, experiments, case studies and statistics. Learn correlation versus causation, confounders and margins of error with demos.
Anyone can claim that a policy works. Political science asks for evidence, and evidence in politics is hard to get. You cannot rerun history with a different electoral law, and the people you study may hide, forget or change their answers when asked. Because of this, the field has built a toolbox of methods that each solve part of the problem and leave other parts unsolved.
This lesson introduces the main tools, the idea of cause and effect, and the most common ways studies go wrong. You will run two small simulations: one that shows how a hidden factor can fake a relationship, and one that shows how much a poll can vary by chance alone.
What you will learn
- how concepts become measurable variables
- the main methods: surveys, experiments, case studies, comparative and statistical analysis
- the difference between correlation and causation, and what a confounder is
- why polls have a margin of error and what it means
Key terms
Variable: a characteristic that can differ across cases, such as turnout or income.
Hypothesis: a testable claim about how variables relate.
Correlation: two variables move together.
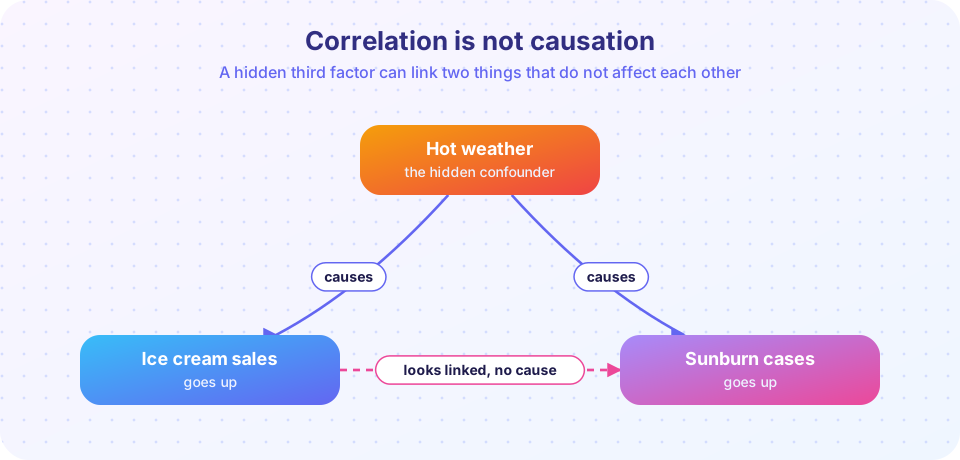
Confounder: a third factor that influences both variables and creates a misleading link.
Sample: the part of a population you actually observe.
From idea to measurement
Political ideas are abstract. "Democracy," "polarization" and "trust in government" cannot be weighed on a scale. Researchers turn them into measurable form in three steps: define the concept clearly, choose an indicator (for example, the share of adults who say they trust parliament), and check that the indicator really captures the concept. This is called operationalization.
Different choices give different answers. A researcher who counts a country as a democracy if it holds elections will classify more countries as democratic than one who also requires free press, independent courts and peaceful transfer of power. When you read a study, ask how its key terms were measured.
The main methods
Surveys. Researchers ask a sample of people questions. Good surveys draw the sample at random so that every person has a known chance of selection. National election studies, such as the American National Election Studies begun in 1948, have asked the same questions for decades. Pitfalls include loaded wording, people giving socially approved answers and low response rates.
Experiments. Researchers assign people at random to a treatment group and a control group and compare outcomes. Random assignment makes the groups alike on average in everything except the treatment, so differences can be blamed on it. Famous field experiments include the get-out-the-vote studies that Donald Green and Alan Gerber began in the late 1990s, which tested how reminders and social pressure affect turnout. Experiments give strong causal evidence but cannot answer big questions such as "does federalism cause stability?"
Case studies. An in-depth look at one country, law or event. Case studies reveal mechanisms, the step-by-step story of how a cause might work. Their weakness is generalizing: one case may be unusual.
Comparative method. Compare a few cases that differ in the cause you care about but are otherwise similar, or that share an outcome. John Stuart Mill described "methods of agreement and difference" in 1843, and they still shape comparative work.
Statistical analysis. With many cases (countries, voters, districts), regression and related tools estimate how one variable relates to another while holding others constant.
Qualitative and historical methods. Interviews, archives and process tracing complement numbers and are essential where data are scarce.
| Method | Strength | Weakness |
|---|---|---|
| Survey | Reaches large populations | Wording and response bias |
| Experiment | Strong causal evidence | Narrow questions, ethics |
| Case study | Shows mechanisms | Hard to generalize |
| Comparison | Tests explanations across settings | Few cases, many causes |
| Statistics | Handles many cases | Hidden confounders |
Correlation and causation
Two variables are correlated if they move together. A study might find that countries with more newspapers have lower corruption. Does the free press cause cleaner government? Perhaps. Or perhaps wealth makes both more likely. Or perhaps cleaner governments allow a freer press. A causal claim needs more than correlation.
Researchers look for three things before they trust a causal claim: the cause comes before the effect, the relationship survives when other factors are held constant, and there is a plausible mechanism. Random experiments satisfy the second condition by design. When experiments are impossible, researchers use natural experiments, in which the world does the randomizing. For example, studies of electoral systems have used cases in which district boundaries or lottery rules created near-random differences.
Confounders: the usual suspect
The picture above shows a classic example. Hot weather raises ice cream sales and also raises sunburn cases. The two outcomes correlate even though one does not cause the other. In politics, a similar pattern appears whenever a third factor, such as national wealth, education or history, affects both the thing you think is a cause and the thing you think is an effect.
The cure is to measure the confounder and adjust for it, or to design a study in which it cannot vary together with the cause.
Sampling and the margin of error
A poll asks a few hundred or thousand people and reports results for millions. If the sample is random, its error follows a known pattern. For a share near 50 percent, the 95 percent margin of error is about 1.96 × √(p(1−p)/n), where p is the share and n the sample size. For n = 1,000 and p = 0.5 this is roughly 3.1 percentage points.
Notice what the formula does not cover: bad question wording, people who cannot be reached, and voters who change their minds. These non-sampling errors can be larger than the margin of error. A poll is a snapshot, not a prophecy.
Bias and ethics
Researchers are people with beliefs. Safeguards include writing down hypotheses before looking at data, sharing data and code so others can check, and peer review. The field has faced a replication problem, as other social sciences have: some well-known findings did not hold up when repeated with new samples. Healthy skepticism is part of the method. Ethical rules also protect participants: informed consent, privacy and avoiding harm. Experiments that interfere with real elections raise serious questions and are now scrutinized by review boards.
Common misconceptions
"A bigger sample always fixes bias." A biased sample stays biased however large. A famous example is the 1936 Literary Digest poll in the United States, which asked millions of people drawn from telephone and car-owner lists and wrongly predicted a landslide for Alf Landon over Franklin Roosevelt.
"If two things correlate, one must cause the other." Correlation can come from chance, reverse causation or a confounder.
"Qualitative work is unscientific." Careful case studies test explanations and reveal mechanisms that numbers alone cannot.
Try it
The first demo builds a fake world in which hot weather drives both ice cream sales and sunburn. It shows a strong correlation between the two, then removes the effect of temperature and checks what is left. This is a simulation with invented numbers.
Press Run (or Ctrl + Enter) to see the result here.
Program input · what you'd type while the program runs
Type the answers before you press Run, one per line. Each time the program reads a line (with input()), it gets the next line from this box.
The raw correlation is strong; after adjusting for heat it falls close to zero. If you did not measure heat, you would be fooled.
The second demo simulates 2,000 polls of 1,000 voters, assuming the true support for a candidate is 52 percent. It shows how results scatter by chance alone.
Press Run (or Ctrl + Enter) to see the result here.
Program input · what you'd type while the program runs
Type the answers before you press Run, one per line. Each time the program reads a line (with input()), it gets the next line from this box.
Change n to 250 and then to 4,000. The spread shrinks with the square root of the sample size, so quadrupling the sample only halves the error.
Check your understanding
Quick check · 5 questions
of 5 answered You scored / 5 · perfect!
-
1. What does random assignment in an experiment achieve?
Random assignment balances other factors on average, so differences can be attributed to the treatment. -
2. In the ice cream and sunburn example, what is hot weather?
It influences both variables and creates a link that is not causal. -
3. Which is a weakness of a single case study?
Case studies give depth, but one case may not represent others. -
4. A poll of 1,000 people has a margin of error of about 3 points. What does NOT affect it?
The margin reflects chance variation in sampling. Wording bias is a separate, non-sampling error. -
5. What did the 1936 Literary Digest poll show about big samples?
Its millions of responses came from lists that over-represented wealthier people, so it missed the real result.
Summary
- Researchers turn abstract concepts into measurable indicators; definitions affect findings.
- Main methods are surveys, experiments, case studies, comparison and statistics, each with trade-offs.
- Correlation is not causation; confounders, chance and reverse causation can create links.
- A poll's margin of error covers sampling chance only, not bias or wording.
- Transparency, replication and ethics keep the field honest.
Next: Chapter 1 Review
Track your progress
Create a free account to tick off lessons and pick up where you left off on any device.
of Political Science lessons completed