


















Lesson 19 of 43 · Neuroscience Foundations
Methods in cognitive neuroscience
Compare EEG, MEG, fMRI, PET, single-neuron recording and brain stimulation by spatial and temporal resolution, and learn the pitfalls of reading brain scans.
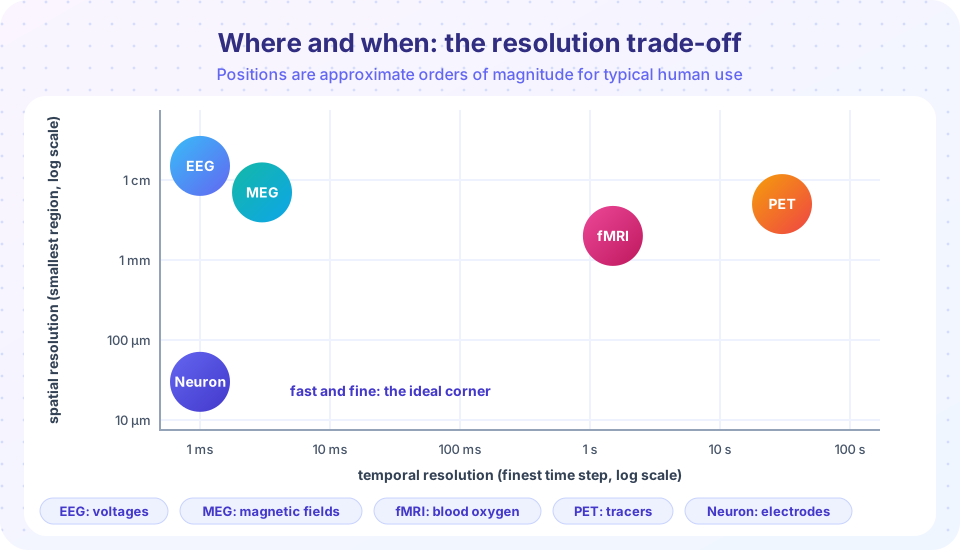
You cannot watch thinking directly, but you can measure its physical side effects: tiny voltages on the scalp, magnetic fields, blood flow, the firing of single cells. Each technique trades off how precisely it tells you where activity happens against how precisely it tells you when. Knowing that trade-off is the key to understanding every brain-imaging headline.
What you will learn
- What EEG, MEG, fMRI, PET, single-neuron recording and brain stimulation measure.
- The trade-off between spatial and temporal resolution.
- How event-related potentials and the BOLD signal work.
- The main pitfalls: reverse inference, multiple comparisons and circular analysis.
Key terms
EEG: electroencephalography, recording electrical activity with scalp electrodes.
ERP: event-related potential, an EEG response averaged over many trials of an event.
fMRI: functional magnetic resonance imaging, measuring blood-oxygen changes linked to neural activity.
BOLD signal: blood oxygen level dependent signal, the fMRI measure.
TMS: transcranial magnetic stimulation, briefly disrupting or exciting a patch of cortex with a magnetic pulse.
Electrical and magnetic recording
EEG. Hans Berger recorded the first human EEG in 1924. Electrodes on the scalp pick up the summed electrical activity of thousands of neurons firing in synchrony. EEG is cheap, safe and has millisecond timing. Its spatial resolution is poor, on the order of centimeters, because the skull and tissue smear the signal and many different source patterns can give the same scalp pattern.
Researchers usually look at event-related potentials. The raw EEG is noisy, but if you average many trials time-locked to a stimulus, random noise cancels and a characteristic waveform remains. Two classic examples: the P300, a positive deflection around 300 ms after a rare or surprising stimulus, and the N400, a negative deflection around 400 ms after a word that does not fit its context (found by Marta Kutas and Steven Hillyard in 1980: "He spread the warm bread with socks").
MEG (magnetoencephalography) measures the tiny magnetic fields produced by the same currents. It has similar timing to EEG, somewhat better localization, and needs expensive shielded rooms and sensors.
Blood-flow imaging
fMRI uses a strong magnet to detect the magnetic properties of blood. When a region becomes more active, local blood flow rises by more than the oxygen use, changing the ratio of oxygenated to deoxygenated hemoglobin. Seiji Ogawa and colleagues showed in 1990 that this produces a measurable signal, the BOLD signal. fMRI gives spatial resolution of a few millimeters (a "voxel" is typically 1 to 3 mm on a side) and can image the whole brain, including deep structures. But it is slow: blood flow responds a few seconds after the neural event and peaks about 5 to 6 seconds later, so the timing is blurred over seconds.
PET (positron emission tomography) tracks injected radioactive tracers to map blood flow or chemistry. It has been important for studying neurotransmitters, but it involves radiation and has lower resolution, so it is used less for cognitive experiments now.
Near-infrared spectroscopy (fNIRS) uses light to measure blood oxygenation near the scalp, which is portable and good for infants but limited to the cortex surface.
Recording from neurons
In animals, and occasionally in patients during surgery, tiny electrodes can record from single cells. David Hubel and Torsten Wiesel found in 1959 that some neurons in cat visual cortex respond to bars of a particular orientation, a discovery that earned them a 1981 Nobel Prize. Single-neuron recording has the best spatial and temporal resolution but samples only a few cells and is invasive.
Stimulation: testing causes
All the above methods are correlational: they show that activity accompanies a task. To test whether a region is necessary, you must interfere with it. TMS, developed in the 1980s, uses a brief magnetic field to induce currents in a small patch of cortex and temporarily disrupt processing. If stimulating a region impairs a task, that is evidence it contributes. Transcranial direct current stimulation (tDCS) passes a weak current and aims to nudge excitability, though its effects are debated. Lesion studies from the previous lesson play the same causal role.
Pitfalls to know
- Reverse inference. Seeing activity in region X and concluding "the person must be doing process Y" is risky, because X is active in many processes. Russell Poldrack (2006) examined this in detail. How strong the inference is depends on how selectively X responds to Y. You will work through the Bayesian arithmetic in the chapter review.
- Multiple comparisons. An fMRI scan has tens of thousands of voxels. Test each at the usual 5% level and many will look significant by chance. In a famous demonstration, Craig Bennett and colleagues (2009) found "active" voxels in a dead salmon when they did not correct for this. Proper correction fixes the problem.
- Circular analysis. Selecting voxels because they correlate strongly with a measure and then reporting the correlation inflates it. Edward Vul and colleagues (2009) criticized many studies for this.
- Small samples and flexibility. Small samples and many analysis choices lead to false positives, which is why large, pre-registered and shared-data studies are increasingly common.
- Pretty pictures. Colored blobs on brain images can make explanations seem more convincing without being better evidence. Read the sample size and the statistics.
Converging methods
The best studies combine tools: fMRI to find where, EEG or MEG to find when, stimulation or patients to test necessity, and models to explain what is computed. This is the principle of converging evidence from chapter 1 applied to the brain.
Common misconceptions
"fMRI shows neurons firing." It measures blood-oxygen changes, an indirect and slow proxy for neural activity.
"A region that lights up is the 'center' for that function." Activity shows involvement, not exclusive responsibility.
"Brain scans can read minds." Decoding methods can predict categories (for example, which of a few pictures someone saw) from patterns in controlled settings. They cannot read arbitrary thoughts.
Try it
Averaging reveals an ERP. We hide a small P300-like bump (5 microvolts, around 300 ms) in noise with a standard deviation of 20 microvolts, then average different numbers of trials. Data are simulated.
Press Run (or Ctrl + Enter) to see the result here.
Program input · what you'd type while the program runs
Type the answers before you press Run, one per line. Each time the program reads a line (with input()), it gets the next line from this box.
A simulated BOLD response. A neural boxcar (10 s of activity) is convolved with a canonical hemodynamic response function, a difference of two gamma curves with a peak at about 5 seconds and a small undershoot. The model is a standard textbook shape, not data from a person.
Press Run (or Ctrl + Enter) to see the result here.
Program input · what you'd type while the program runs
Type the answers before you press Run, one per line. Each time the program reads a line (with input()), it gets the next line from this box.
Check your understanding
Quick check · 5 questions
of 5 answered You scored / 5 · perfect!
-
1. Which method has millisecond timing but poor spatial resolution?
EEG follows activity in real time but cannot easily locate its sources. -
2. What does the BOLD signal measure?
BOLD is an indirect, slow signal based on blood oxygen levels. -
3. Why average many trials in ERP research?
Noise falls roughly with the square root of the number of trials. -
4. Which method best supports a causal claim that a region is necessary for a task?
Interfering with a region and seeing impairment tests necessity, while imaging shows correlation. -
5. The dead salmon study illustrated the problem of
With thousands of voxels tested, some appear significant by chance unless corrected.
Summary
- EEG and MEG have millisecond timing with limited localization; fMRI localizes to millimeters but is slow; single-neuron recording is precise but invasive.
- ERPs reveal small time-locked responses by averaging; the BOLD signal is a delayed, smoothed proxy for neural activity.
- Stimulation and lesion studies test necessity; imaging mainly shows correlation.
- Beware reverse inference, uncorrected multiple comparisons, circular analysis and small samples.
Next: Chapter 4 review
Track your progress
Create a free account to tick off lessons and pick up where you left off on any device.
of Cognitive Science lessons completed