


















Lesson 14 of 44 · Measurement and Sampling
Sampling and Populations
How researchers choose participants: populations, samples, random, stratified, cluster and convenience sampling, sampling bias, and why 2.4 million responses once failed to predict an election.
In 1936, the magazine Literary Digest mailed out millions of ballots to predict the US presidential election. About 2.4 million people replied, and the magazine confidently forecast that Alf Landon would beat Franklin Roosevelt. Roosevelt won in a landslide. A young pollster, George Gallup, predicted the right winner using a much smaller sample of about fifty thousand people chosen more carefully. The lesson that still sits at the center of research methods: how you choose people matters more than how many you choose.
This lesson explains populations and samples, the main ways to select participants, and the biases that spoil them.
What you will learn
- The difference between a population, a sampling frame and a sample.
- Probability sampling methods: simple random, stratified and cluster.
- Non-probability methods such as convenience and volunteer samples.
- How sampling bias and sampling error differ, and how sample size affects error.
Key terms
Population: the entire group you want to draw conclusions about.
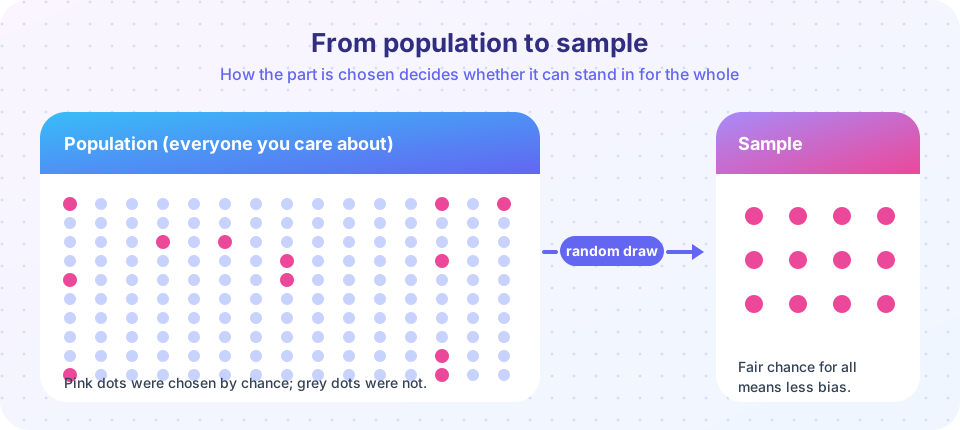
Sample: the part of the population you actually study.
Sampling frame: the list from which the sample is drawn.
Random sampling: every member of the population has a known chance of being chosen.
Sampling bias: a systematic difference between the sample and the population caused by how people were selected.
Population, frame and sample
Suppose you want to know how many hours per week 16-year-olds in your country spend on homework. The population is all 16-year-olds in the country. You cannot ask everyone, so you ask a sample. A sampling frame is the practical list you pick from, for example a list of all registered schools. If the frame leaves out some of the population (home-schooled teens), the sample cannot represent them.
Probability sampling
In probability sampling, every member of the frame has a known chance of selection. This is what allows statistical statements about how far the sample can differ from the population.
- Simple random sampling: every person has an equal chance, like drawing names from a hat. It is the gold standard but needs a full list.
- Systematic sampling: choose every kth person from the list after a random start.
- Stratified random sampling: divide the population into groups (strata), such as age bands or regions, and sample randomly within each in proportion to its size. This guarantees that small but important groups appear.
- Cluster sampling: randomly select whole groups such as schools or villages, then study everyone, or a random subset, within them. It is cheaper when people are spread out but usually less precise.
Non-probability sampling
- Convenience sampling: whoever is easy to reach. A great deal of psychology has used university students taking part for course credit.
- Volunteer (self-selected) sampling: people choose to respond, as in an online poll. Those who respond may be those with strong opinions.
- Quota sampling: fill set quotas (50 percent women, for example), but pick people non-randomly within each.
- Snowball sampling: participants recruit others. It is useful for hidden populations, but it can produce samples of similar people.
These methods are common because they are practical. Their cost is that you cannot compute how wrong the sample might be, and bias is likely.
Bias versus error
Sampling error is the random difference between a sample's value and the population's value. It is unavoidable but predictable: it shrinks as the sample grows. A rough rule for a proportion is that the 95 percent margin of error is about 1 / sqrt(n), so 100 people give about plus or minus 10 percentage points and 1,000 give about plus or minus 3.
Sampling bias is systematic. In 1936 the Literary Digest drew names from telephone directories and automobile registrations, at a time when many poorer voters had neither, and the responses came mostly from people who chose to mail them back. The bias pointed in one direction and a bigger sample only made the error more confident. Non-response matters as well: if the people who refuse to answer differ from those who answer, the data are skewed.
WEIRD samples
In 2010, Joseph Henrich, Steven Heine and Ara Norenzayan reviewed research and pointed out that much of it rested on participants from Western, educated, industrialized, rich and democratic societies, a tiny slice of humanity. On some tasks, such as certain visual illusions or fairness judgments in economic games, results from these groups differed from those of people elsewhere. This does not mean all results are wrong. It means that claims about "human nature" need evidence from varied groups.
Choosing sample size
How large should a sample be? It depends on how large the effect is expected to be, how much precision you need, and how much money and time you have. Small samples give noisy estimates and often miss real effects. Chapter 6 introduces statistical power, which gives a principled way to choose.
Common misconceptions
"A large sample is always representative." Size reduces random error, not bias.
"Random sampling and random assignment are the same." Random sampling chooses who is in the study. Random assignment decides which condition each participant gets. They solve different problems (external versus internal validity).
"Students are fine because people are all alike." They may be fine for basic processes but not for everything, so claims need checking in other groups.
Try it
Press Run (or Ctrl + Enter) to see the result here.
Program input · what you'd type while the program runs
Type the answers before you press Run, one per line. Each time the program reads a line (with input()), it gets the next line from this box.
Press Run (or Ctrl + Enter) to see the result here.
Program input · what you'd type while the program runs
Type the answers before you press Run, one per line. Each time the program reads a line (with input()), it gets the next line from this box.
Check your understanding
Quick check · 5 questions
of 5 answered You scored / 5 · perfect!
-
1. Why did the 1936 Literary Digest poll fail despite 2.4 million replies?
A biased selection method gives a confidently wrong answer, however many people respond. -
2. In stratified random sampling, you
Strata guarantee that key subgroups are represented in the right proportions. -
3. Random assignment differs from random sampling because random assignment
Random assignment supports internal validity; random sampling supports external validity. -
4. Roughly how large is the 95% margin of error for a proportion with n = 100 from a random sample?
The rule of thumb 1 / sqrt(n) gives 0.1, so about 10 points. -
5. What does the WEIRD critique say?
Samples from Western, educated, industrialized, rich, democratic societies may not represent all humans.
Summary
- A population is the target group; a sample is the part you study, drawn from a sampling frame.
- Probability sampling (simple, systematic, stratified, cluster) allows statements about sampling error.
- Convenience and volunteer samples are practical but prone to bias.
- Bigger samples reduce random error but not bias, and random sampling is not random assignment.
Track your progress
Create a free account to tick off lessons and pick up where you left off on any device.
of Research Methods in Psychology lessons completed