


















Lesson 29 of 44 · Statistics for Psychologists
Power and Sample Size
Learn what statistical power is, how effect size, alpha and sample size determine it, and why small underpowered studies miss real effects and exaggerate the ones they find.
Imagine searching for a lost key in a dark room with a tiny flashlight. If you find nothing, does the key not exist? Not necessarily: your light may be too weak to see it. A study with too few participants is that flashlight. A non-significant result from a small study tells you little, and the problem is not just missed effects. As this lesson shows, small studies also exaggerate the effects they do find. Planning the sample size in advance is the cure, and it is one of the highest-value habits in research methods.
What you will learn
- What statistical power is and what 80% power means.
- The four factors that determine power.
- How to find a sample size with an a priori power analysis.
- Why low-powered studies produce inflated effect estimates.
- Why you should not use observed power after the fact.
Key terms
Power (1 - beta): the probability of rejecting the null hypothesis when a true effect of a given size exists.
A priori power analysis: choosing the sample size before collecting data, from the smallest effect size of interest, alpha and the desired power.
Smallest effect size of interest (SESOI): the smallest effect that would be practically or theoretically meaningful.
Winner's curse (Type M error): the tendency for statistically significant effects from small studies to overestimate the true effect (M for magnitude).
What power means
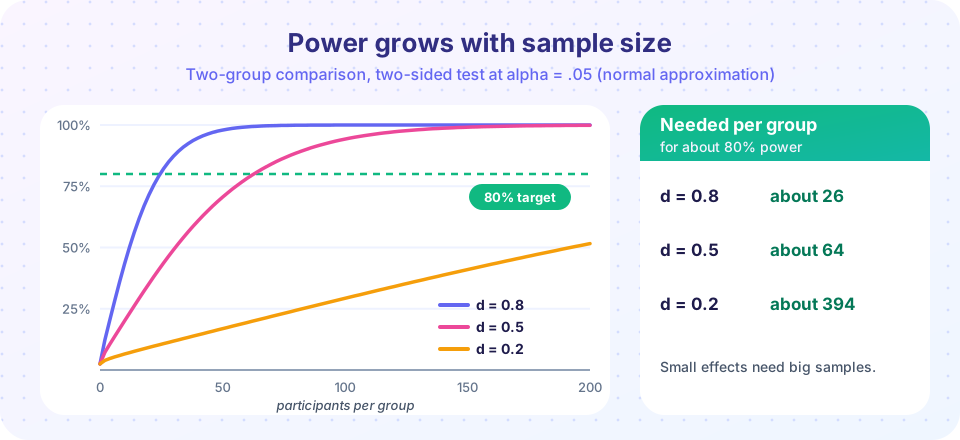
Suppose a real effect of d = 0.5 exists. If you ran the same experiment 100 times with 30 participants per group, you would find a significant difference in only about half of them. Your power is about 50%. The other half are Type II errors, misses. Power of 80% means that you would detect the effect in four out of five studies. The 80% target was suggested by Jacob Cohen as a reasonable balance between cost and the risk of missing an effect; many people now aim for 90%.
Power is not a property of an experiment alone but of an experiment plus a particular true effect. It makes no sense to say "this study has 80% power" without saying "to detect an effect of size ...".
What determines power
Four ingredients, and changing any one changes power:
| Factor | Direction | Practical lever |
|---|---|---|
| Sample size | More participants, more power | Recruit more people |
| Effect size | Bigger effect, more power | Strengthen the manipulation; choose a sensitive measure |
| Alpha | Higher alpha, more power (but more false positives) | Usually fixed at .05 |
| Variability | Less noise, more power | Reliable measures, within-subjects design, controlled settings |
The lever you control most is sample size, followed by cleverly choosing the design. Recall from the design lessons that a within-subjects experiment removes between-person differences, which can raise power dramatically at the same number of people.
Doing a power analysis
An a priori power analysis runs backward: you pick the effect size you want to detect, alpha and the power, then solve for the number of participants.
- Decide the smallest effect worth detecting. This is the hard, scientific step. Use prior meta-analyses, pilot data (cautiously, since small pilots give noisy estimates), or the smallest effect that would matter in practice.
- Set alpha (.05 is typical) and power (.80 to .95).
- Compute n with software. G*Power is a popular free program; R and Python have packages; the code below does it from first principles.
- Write the number in your preregistration (Chapter 7) before collecting data.
For a two-group comparison with a medium effect (d = 0.5), the answer is about 64 participants per group, 128 in total. For a small effect (d = 0.2) it is 394 per group. That is why researchers who hope to detect subtle effects need very large samples.
The hidden cost of small studies: inflated effects
Here is the unexpected part. Suppose the true effect is small and your study is underpowered. When you do get a significant result, it will tend to be one where sampling chance happened to push the observed effect upward, because only large observed differences clear the significance bar in a small sample. Among significant results from underpowered studies, the average estimated effect is therefore larger than the truth. This is the winner's curse. It helps explain why published effects often shrink when replicated with larger samples. It also means that "it was significant even with a small sample, so the effect must be strong" is the reverse of sound reasoning.
Low power has been documented repeatedly. Jacob Cohen's 1962 review of papers in a leading abnormal-psychology journal found that studies had roughly even odds, at best, of detecting a medium effect. In 2013 Katherine Button and colleagues estimated that typical neuroscience studies had power of about one in five. Understanding this is part of reading research critically.
Common misconceptions
"I got a significant result, so my study had enough power." Power is a property of the design before the data are seen. A lucky significant result from an underpowered design is exactly the situation that produces inflated estimates.
"Observed power tells me why I failed." Post-hoc ("observed") power computed from your own p-value is just a re-expression of p and adds no information. Use confidence intervals to describe what your data can and cannot rule out.
"A sample of 30 is always enough." The needed size depends on the effect. A rule of thumb that ignores effect size will be wrong most of the time.
Try it
First, a power calculator using the noncentral t distribution (the exact method for a two-sample t-test). It finds the smallest sample per group that reaches the target power for a given effect size.
Press Run (or Ctrl + Enter) to see the result here.
Program input · what you'd type while the program runs
Type the answers before you press Run, one per line. Each time the program reads a line (with input()), it gets the next line from this box.
Second, a simulation (made-up studies of a true small effect of d = 0.3 with 20 people per group) showing the winner's curse. The code keeps only the studies that came out significant and compares their average estimated effect with the truth.
Press Run (or Ctrl + Enter) to see the result here.
Program input · what you'd type while the program runs
Type the answers before you press Run, one per line. Each time the program reads a line (with input()), it gets the next line from this box.
In one run of this seeded simulation about 15% of the studies were significant (the design has low power for a small effect), and the average observed d among the significant ones was about 0.8, more than double the true 0.3. Averaged over all studies, the estimate was correct at about 0.3. The bias comes entirely from keeping only the winners.
Check your understanding
Quick check · 5 questions
of 5 answered You scored / 5 · perfect!
-
1. What does 80% power mean?
Power is the long-run proportion of studies that detect a true effect of a given size. -
2. Which change does NOT increase power?
More noise lowers power. The other three options increase it. -
3. Roughly how many participants per group give 80% power for d = 0.5 at alpha = .05?
A two-sample t-test needs 64 per group for a medium effect. -
4. The winner's curse refers to...
In small studies only large observed effects pass the significance bar, so significant estimates are inflated. -
5. Why is 'observed power' computed after a study not useful?
Observed power is a one-to-one function of the p-value, so it cannot explain a non-significant result.
Summary
- Power is the chance of detecting a true effect of a stated size; 80% to 90% is the usual target.
- Sample size, effect size, alpha and variability determine it; design choices such as within-subjects raise it.
- Do an a priori power analysis from the smallest effect size of interest and record it in a preregistration.
- Underpowered studies miss real effects and inflate the ones they find (the winner's curse).
- Avoid post-hoc "observed power"; use confidence intervals instead.
Track your progress
Create a free account to tick off lessons and pick up where you left off on any device.
of Research Methods in Psychology lessons completed