


















Lesson 12 of 44 · Measurement and Sampling
Levels of Measurement
Understand S. S. Stevens's four levels of measurement, with psychology examples, the statistics each level allows, and the debate over treating rating scales as interval data.
A number is not always a number. The 7 on a football shirt tells you nothing about size. The 7 in "7 kilometers" tells you a distance, and 14 kilometers is exactly twice as far. The 7 in "7 out of 10 in pain" tells you something in between. The type of information a number carries is its level of measurement, and it decides which calculations make sense.
In 1946 the psychologist S. S. Stevens proposed four levels. They are still taught everywhere, and knowing them prevents many silly analyses, such as averaging zip codes.
What you will learn
- The four levels: nominal, ordinal, interval and ratio.
- What properties each level has and what you can calculate with it.
- How to identify the level of a variable in a study.
- Why Likert-type rating scales are debated.
Key terms
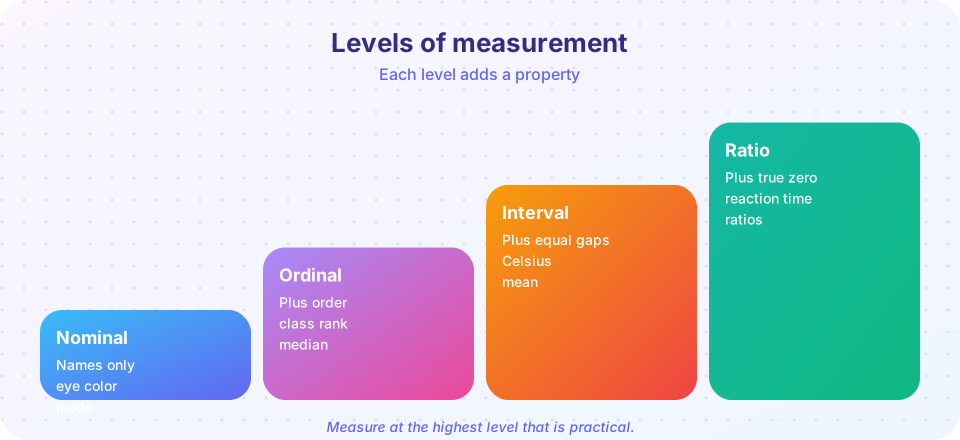
Nominal: categories with names only, no order.
Ordinal: ordered categories, with unknown or unequal gaps.
Interval: equal gaps between values but no true zero.
Ratio: equal gaps and a true zero, so ratios make sense.
Mode, median, mean: the most common value, the middle value and the arithmetic average.
The four levels
Nominal
Values are labels. Eye color, favorite subject, which experimental condition someone was in, and diagnosis category are nominal. You can count how many fall in each category and report the mode. Averaging makes no sense.
Ordinal
Values have an order, but the gaps between them are not known to be equal. Finishing position in a race (first, second, third) is ordinal: the gap between first and second may be a hair or a minute. A class rank is ordinal. A median is appropriate, and so are percentiles.
Interval
Values are ordered with equal gaps, but zero is arbitrary, so it does not mean "none." Temperature in degrees Celsius is the standard example: the difference between 20 and 30 degrees is the same as between 30 and 40, but 0 degrees does not mean no temperature, and 40 degrees is not "twice as hot" as 20. The mean and standard deviation are appropriate.
Ratio
Values have equal gaps and a true zero. Reaction time in milliseconds, number of words recalled, height, and income are ratio. Zero means none of the quantity, so statements like "twice as fast" are meaningful. All statistics are allowed.
Summary table
| Level | Order? | Equal gaps? | True zero? | Typical statistic | Example |
|---|---|---|---|---|---|
| Nominal | No | No | No | Mode, counts | Handedness |
| Ordinal | Yes | No | No | Median | Rank in class |
| Interval | Yes | Yes | No | Mean | Temperature in Celsius |
| Ratio | Yes | Yes | Yes | Mean, ratios | Reaction time |
The rating-scale debate
Psychologists often use Likert-type items: "How anxious do you feel? 1 (not at all) to 5 (extremely)." Rensis Likert introduced this style of scale in 1932. Strictly speaking, a single item is ordinal, since we cannot be sure that the gap from 1 to 2 equals the gap from 4 to 5. Yet researchers frequently compute means of such scores, especially when they add several items into a total. Methodologists disagree. One view says ordinal data should use medians and rank-based tests. Another notes that, in practice, treating well-constructed multi-item scales as interval often gives similar conclusions. A careful researcher states the choice and checks that the results hold under the stricter approach.
Why levels matter
The level of measurement affects:
- Which summaries are meaningful. The "average" favorite color is nonsense.
- Which statistical tests are suitable. Chapter 6 shows that many common tests assume at least interval data.
- How much information you throw away. Converting a continuous score into categories ("high" and "low") loses information and can weaken your study.
As a rule, measure at the highest level that is practical. You can always reduce ratio data to categories, but you cannot go the other way.
Common misconceptions
"If it is a number, you can average it." Participant ID numbers, jersey numbers and category codes are labels.
"Interval means ratio." Without a true zero, you cannot say that 40 degrees is twice 20 degrees.
"Ordinal data can never be averaged." It is debated. Be explicit about the choice and test whether the conclusion depends on it.
Try it
Press Run (or Ctrl + Enter) to see the result here.
Program input · what you'd type while the program runs
Type the answers before you press Run, one per line. Each time the program reads a line (with input()), it gets the next line from this box.
Check your understanding
Quick check · 5 questions
of 5 answered You scored / 5 · perfect!
-
1. Which variable is nominal?
Handedness gives categories with no order. -
2. Why is Celsius an interval, not ratio, scale?
Celsius has equal gaps but an arbitrary zero, so ratios like 'twice as hot' are not meaningful. -
3. Which statistic is most suitable for ordinal data?
The median uses order only. A mean assumes equal gaps. -
4. Who proposed the four levels of measurement in 1946?
Stanley Smith Stevens proposed nominal, ordinal, interval and ratio scales. -
5. Why is it usually better to measure at a higher level?
Higher levels carry more information, and you can collapse them to lower levels but not reverse.
Summary
- Nominal data name categories; ordinal data add order; interval data add equal gaps; ratio data add a true zero.
- The level decides which summaries and tests are meaningful.
- Single rating-scale items are technically ordinal, and treating total scores as interval is a common but debated choice.
- Measure at the highest practical level.
Track your progress
Create a free account to tick off lessons and pick up where you left off on any device.
of Research Methods in Psychology lessons completed