


















Lesson 20 of 44 · Descriptive and Correlational Studies
Chapter 4 Review: Descriptive and Correlational Studies
Review observation, case studies, surveys and correlation with a recap table and a ten-question mixed quiz that closes chapter 4 of Research Methods in Psychology.
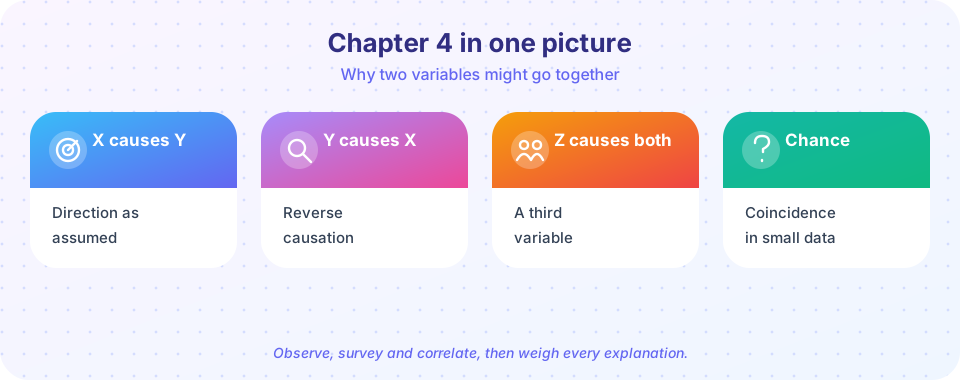
Chapter 4 covered the methods that look, ask and relate. You learned how to plan an observation and check agreement, how to write a survey and score a scale, and how to read a correlation without being fooled. This review gathers the chapter and tests it.
Recap table
| Method | Good for | Main limits |
|---|---|---|
| Naturalistic observation | Realistic behavior, new ideas | Observer bias, reactivity, no cause |
| Case study | Rare or deep cases | Poor generalization, subjective interpretation |
| Survey | Attitudes and reports from many people | Wording effects, response biases, non-response |
| Correlation | Prediction, relationships you cannot manipulate | Third variables, reverse causation, outliers, restricted range |
Check your understanding
Quick check · 10 questions
of 10 answered You scored / 10 · perfect!
-
1. A researcher tallies every time a child shares a toy during a 30-minute play session. This is
Event sampling records each occurrence of a defined behavior. -
2. Two observers code the same video. Percent agreement is 90 percent, but one category covers almost all the intervals. Why might kappa be much lower?
When one category dominates, chance agreement is high, and kappa corrects for it. -
3. Which is a limit of case studies such as H.M.?
A single case may be unusual, so conclusions need confirmation from other cases and methods. -
4. The question 'Do you exercise and eat healthily?' is flawed because it is
It asks two things at once and cannot be answered cleanly. -
5. On a 1 to 5 scale, a reverse-coded item answered 2 scores
6 minus 2 is 4. -
6. Tendency to agree with statements regardless of content is called
Acquiescence bias is balanced by mixing positively and negatively worded items. -
7. A correlation of r = -0.6 means
The sign shows direction. The coefficient alone does not show cause. -
8. If r = 0.4, about how much variation do the variables share?
r squared is 0.16, which is 16 percent. -
9. Hot weather increasing both ice cream sales and swimming deaths is an example of
A shared cause creates a correlation without a direct link. -
10. Which approach best helps decide whether depression leads to inactivity or the reverse?
Repeated measurement shows time order, which is a key piece of causal evidence.
Summary
- Observation, surveys and correlations describe and predict but do not alone show cause.
- Plan carefully: define behaviors, word questions neutrally, and plot your data.
- Always ask about direction and third variables before reading cause into a correlation.
Track your progress
Create a free account to tick off lessons and pick up where you left off on any device.
of Research Methods in Psychology lessons completed