


















Lesson 26 of 44 · Statistics for Psychologists
Chapter 6 Overview: Statistics for Psychologists
Preview the statistics psychologists use to turn samples into conclusions: sampling variability, p-values, t-tests, effect sizes and statistical power.
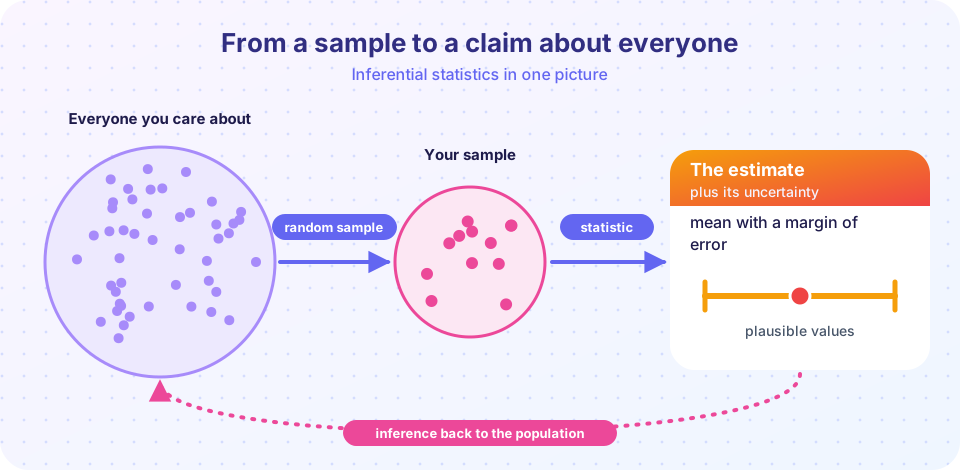
Every psychology study ends the same way: you have data from a few dozen or a few thousand people, and you want to say something about people in general. The step from "what happened in my sample" to "what is probably true beyond it" is inference, and it is where statistics earns its place in the research process. This chapter is not a full statistics course. (The tracks listed at the end of the course go deeper.) It teaches the specific ideas a psychology researcher must understand to run a study sensibly and read a paper critically.
What you will learn
- Why sample statistics vary from sample to sample.
- What a null hypothesis and a p-value are, and what they are not.
- How to compare two means with a t-test and report an effect size.
- What statistical power is and how to choose a sample size before you collect data.
The big picture
Imagine you measure the memory scores of 30 randomly chosen students and get a mean of 24. Another random 30 would give 23.1, another 25.2. The sample mean wobbles around the true population mean. This wobble is sampling variability, and it is the reason a difference between two groups is never automatically meaningful. A treatment group might beat a control group by three points just because the particular people who landed in it happened to be a little sharper.
Inferential statistics answers one question: how much of what I see could be this kind of chance wobble? Three numbers help.
- The p-value tells you how surprising your data would be if there were no real effect.
- The effect size tells you how big the difference is, in units that can be compared across studies.
- The power of a design tells you how likely it is to detect an effect of a given size, and is what you plan before collecting data.
Chance wobbles every sample
Three numbers to report
A sensible workflow
What each lesson covers
| Lesson | Question it answers |
|---|---|
| p-values and null hypotheses | What does "statistically significant" really mean? |
| t-tests and effect sizes | How do I compare two means, and how big is the difference? |
| Power and sample size | How many participants do I need? |
| Chapter review | Can I put it all together? |
Try it: watch the wobble
This simulation (made-up population, honest stand-in) draws 2,000 random samples of 30 people from a population whose true mean is 100 and plots every sample mean. Notice how tightly the means cluster compared with individual scores, and how wide the spread still is.
Press Run (or Ctrl + Enter) to see the result here.
Program input · what you'd type while the program runs
Type the answers before you press Run, one per line. Each time the program reads a line (with input()), it gets the next line from this box.
Check your understanding
Quick check · 4 questions
of 4 answered You scored / 4 · perfect!
-
1. Why can two random samples from the same population have different means?
Random samples contain different individuals, so their statistics vary around the population value. -
2. The standard error describes...
It is the standard deviation of the sampling distribution of a statistic such as the mean. -
3. Which number should be planned BEFORE collecting data?
A power analysis chooses the sample size in advance. -
4. What does inference try to do?
Inference generalizes beyond the sample and quantifies how uncertain the generalization is.
Summary
- Statistics from random samples wobble; inference quantifies how much.
- p-values, effect sizes and power each answer a different question.
- Planning (power) comes before collecting data; reporting (effect size, interval) comes after testing.
Track your progress
Create a free account to tick off lessons and pick up where you left off on any device.
of Research Methods in Psychology lessons completed