


















Lesson 19 of 44 · Descriptive and Correlational Studies
Correlation and Causation
Learn to read scatterplots and Pearson's r, understand why correlation does not prove causation, and spot third variables, reverse causation, outliers and restricted range.
Ice cream sales and drowning deaths rise and fall together across the year. Does ice cream cause drowning? Of course not. Both rise in hot weather, when people eat more ice cream and swim more. This tiny story contains the most repeated warning in research methods: correlation does not imply causation.
But the warning is often said so quickly that its meaning gets lost. This lesson explains what a correlation is, how to read one, why it can mislead, and what a careful researcher does next. You will also see that correlations are valuable, not just dangerous.
What you will learn
- What a correlation coefficient (Pearson's r) measures and how to read its size and sign.
- How to read a scatterplot, including outliers and curved patterns.
- Three explanations for a correlation: X causes Y, Y causes X, or a third variable causes both.
- Why researchers still use correlations, and how they gather evidence about causes.
Key terms
Correlation: a statistical relationship between two variables.
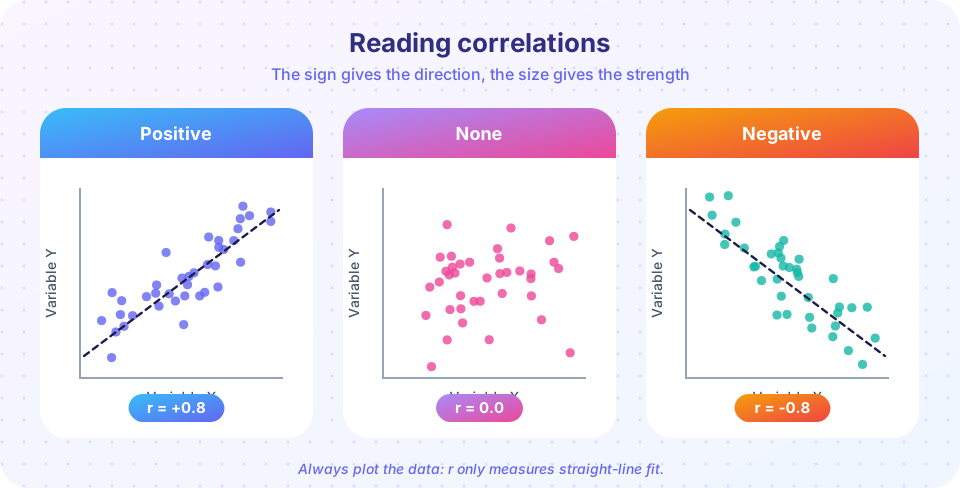
Pearson's r: a number from -1 to +1 describing the strength and direction of a linear relationship.
Scatterplot: a graph with one dot per person, positioned by their scores on two variables.
Third variable (confound): a variable that influences both measured variables and creates a relationship between them.
Coefficient of determination (r squared): the share of variation in one variable that is shared with the other.
Reading r
Pearson's r (from Karl Pearson, 1890s) ranges from -1 to +1.
- Sign: positive means that as one variable rises, the other tends to rise. Negative means that as one rises, the other tends to fall.
- Size: the farther from zero, the stronger the linear relationship. Rough labels, which vary between fields: about 0.1 small, 0.3 medium, 0.5 or more large (Jacob Cohen's widely used suggestions for behavioral science).
- r squared: if r is 0.5, then r squared is 0.25, so about 25 percent of the variation in one variable is shared with the other. This shows that even a "large" correlation leaves most variation unexplained.
A correlation allows prediction: if hours of sleep and mood are correlated, knowing someone's sleep helps you guess their mood, though not perfectly. Prediction does not need causation.
Scatterplots matter
Always look at the plot. The same r can come from very different patterns. In 1973 Francis Anscombe published four small datasets with almost identical means, variances and correlations but completely different shapes: one a clean line, one a curve, one with a single outlier dragging the line, one a vertical stack with a single extreme point. Watch for:
- Outliers: one extreme point can create or destroy a correlation.
- Curved relationships: performance rises with arousal and then falls (the Yerkes-Dodson idea). Pearson's r misses this, because it measures only straight-line fit.
- Restricted range: if you study only students who were admitted to a selective course, the link between admission test and grades looks weaker than in the full applicant pool.
Three explanations for a correlation
If X and Y are correlated:
- X causes Y (directionality as assumed).
- Y causes X (reverse causation). Does depression lead to less exercise, or does less exercise lead to depression? Perhaps both.
- Z causes both (a third variable). Hot weather drives ice cream sales and swimming. Children's age drives both shoe size and reading skill.
There is also coincidence: with many variables and few data points, some correlations arise by chance.
A famous series of "spurious correlation" charts shows absurd matches, such as the number of films a certain actor appeared in matching the number of drownings in a given year. They are funny precisely because there is no plausible link, and they show how easy it is to find patterns by searching widely.
Evidence about causes beyond experiments
Often experiments are impossible. We cannot randomly assign people to smoke for thirty years. The link between smoking and lung cancer was established through many lines of evidence: correlations in many countries, a dose-response pattern (more smoking, more risk), a time order (smoking came first), a plausible mechanism, and the lack of a better alternative explanation. The epidemiologist Austin Bradford Hill proposed a list of such considerations in 1965. In psychology, researchers use:
- Longitudinal designs that measure the same people over time to check time order.
- Statistical control of measured third variables (partial correlation, regression).
- Natural experiments where chance or policy changes create something like random assignment.
- Experiments that manipulate the suspected cause, covered in chapter 5.
Statistical control only handles variables you measured. Unmeasured third variables can still lurk.
Common misconceptions
"Correlation means no causation." It means correlation alone does not establish it. Many correlations do reflect causes.
"r = 0 means no relationship." It means no linear relationship. A strong curved pattern can have r near zero.
"A strong correlation proves a strong effect." r describes how tightly points cluster, not how big the effect is in real units.
Try it
Press Run (or Ctrl + Enter) to see the result here.
Program input · what you'd type while the program runs
Type the answers before you press Run, one per line. Each time the program reads a line (with input()), it gets the next line from this box.
Press Run (or Ctrl + Enter) to see the result here.
Program input · what you'd type while the program runs
Type the answers before you press Run, one per line. Each time the program reads a line (with input()), it gets the next line from this box.
Check your understanding
Quick check · 6 questions
of 6 answered You scored / 6 · perfect!
-
1. Ice cream sales and drownings both rise in summer. The best explanation is
Temperature increases both ice cream eating and swimming, creating a correlation without a direct link. -
2. If r = 0.5, what is r squared?
0.5 squared is 0.25, so 25 percent of the variation is shared. -
3. A correlation of nearly zero can still hide
Pearson's r measures straight-line fit only, so a strong curve can give r near zero. -
4. Depressed people exercise less. A researcher says 'less exercise causes depression.' What alternative must be considered?
Both directions, and third variables, fit a correlation equally well. -
5. Which design best addresses time order in a correlational question?
Measuring the same people over time shows which variable came first. -
6. Restricting the range of a variable (only high scorers) usually
Less variation in one variable leaves less to correlate, so r tends to shrink.
Summary
- Pearson's r gives the direction and strength of a linear relationship; r squared is shared variation.
- Always plot the data: outliers, curves and restricted range can mislead r.
- A correlation can reflect X to Y, Y to X, a third variable or chance.
- Correlations enable prediction and suggest hypotheses; causal conclusions need time order, control of other variables or experiments.
Next: Chapter 4 Review: Descriptive and Correlational Studies
Track your progress
Create a free account to tick off lessons and pick up where you left off on any device.
of Research Methods in Psychology lessons completed