


















Lesson 27 of 44 · Statistics for Psychologists
p-Values and Null Hypotheses
Understand null hypothesis significance testing: what a p-value is and is not, Type I and Type II errors, alpha, and why significance differs from importance.
"The difference was statistically significant, p = .03." Few sentences in science are repeated more often or misunderstood more. A 2002 survey by Haller and Krauss found that most of the students and even most of the methodology instructors they asked endorsed at least one false statement about what a p-value means. This lesson gives you the correct meaning, builds intuition by simulation, and warns you off the most common errors.
What you will learn
- The logic of null hypothesis significance testing (NHST).
- The exact definition of a p-value and five things it does not mean.
- Type I and Type II errors and the role of alpha.
- The difference between statistical and practical significance.
- How to run a permutation test to see a p-value being built.
Key terms
Null hypothesis (H0): the claim of "no effect" or "no difference" that the test tries to challenge.
Alternative hypothesis (H1): the claim that there is an effect, often directional or just "not zero".
p-value: the probability of getting data at least as extreme as yours if the null hypothesis (and the test's assumptions) were true.
Alpha (significance level): the threshold, conventionally .05, below which you call a result statistically significant.
Type I error: rejecting a true null (a false positive).
Type II error: failing to reject a false null (a miss).
The logic of the test
NHST is a proof by contradiction with probabilities. You cannot prove that your treatment works, but you can ask how surprising your data would be in a world where it does nothing.
- State the null. "The new method has no effect on recall; the true difference is zero."
- Collect data and compute a statistic, such as the difference between group means or a t value.
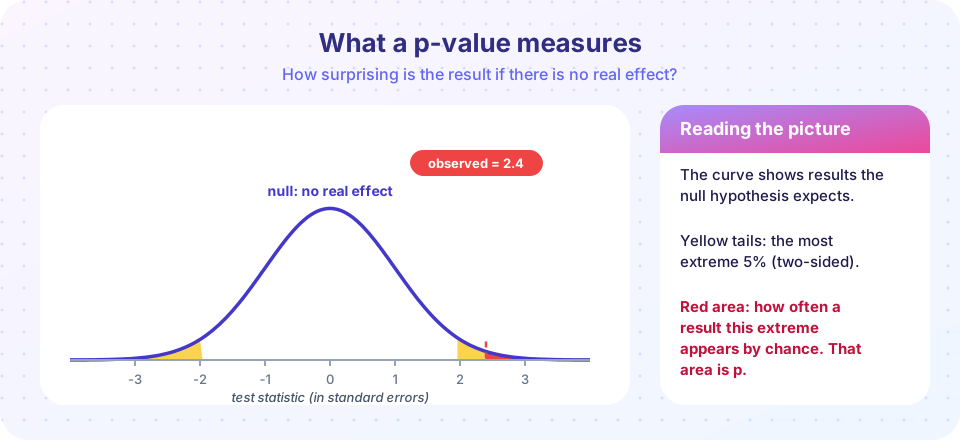
- Ask: if the null were true, how often would random sampling alone produce a statistic at least this extreme? That probability is the p-value.
- Decide. If p is below alpha (usually .05), you reject the null and call the result statistically significant. If not, you fail to reject it. That does not show the null is true; it means your data did not rule it out.
The two schools behind this are worth knowing. Ronald Fisher (1925) treated p as a graded measure of evidence against the null. Jerzy Neyman and Egon Pearson (1930s) built a decision framework with fixed error rates set in advance. Textbook NHST is a hybrid of the two that neither man fully endorsed. The ".05" convention comes from Fisher's suggestion that results beyond roughly two standard errors are worth a second look; it is a convention, not a law of nature.
The correct meaning of p
Read it slowly: p is the probability of data this extreme or more extreme, assuming the null hypothesis is true. It is a statement about the data given the hypothesis, not about the hypothesis given the data.
What p is not:
- It is not the probability that the null hypothesis is true. A p of .03 does not mean there is a 3% chance of no effect.
- It is not the probability that the result happened "by chance alone."
- It is not the probability that you would get the same result if you replicated the study.
- It is not the size or importance of the effect. A tiny effect can have a minuscule p in a huge sample.
- A non-significant result is not evidence that there is no effect. Small studies often fail to detect real effects (next lessons).
In 2016 the American Statistical Association took the unusual step of issuing a statement on p-values (Wasserstein and Lazar). Its main points: p-values can indicate how incompatible data are with a statistical model; they do not measure the probability that a hypothesis is true; and a conclusion should never rest on whether p passes a threshold alone.
Type I and Type II errors
Any decision can be wrong in two ways.
| Null is actually true | Null is actually false | |
|---|---|---|
| Reject the null | Type I error (false positive), probability = alpha | Correct (power = 1 - beta) |
| Fail to reject | Correct | Type II error (miss), probability = beta |
Alpha is the false-positive rate you are willing to accept when the null is true. At alpha = .05, if you run many studies of effects that do not exist, about one in twenty will come out "significant" by luck. Beta is the miss rate, and 1 - beta is power, the subject of the lesson after next.
One-tailed or two-tailed?
A two-tailed test counts extreme results in both directions; it asks "is there any difference?" A one-tailed test counts only one direction. Because it puts all the 5% in one tail, it makes it easier to reach significance, which is why it needs to be justified before seeing the data. Most journals expect two-tailed tests unless there is a strong, pre-stated reason.
Statistical versus practical significance
"Significant" in statistics means "unlikely under the null," not "important." Given enough participants, even a difference of a fraction of a point becomes significant. Conversely, a large, meaningful difference may fail to reach significance in a small study. Always ask: how big is the effect, and does that size matter to anyone? (That is the job of effect sizes, covered next lesson.)
Common misconceptions
"p = .04 means there is a 96% chance the effect is real." No. p is computed assuming the effect is zero. It cannot tell you the probability that the effect is real. That requires prior information, as in Bayesian methods.
"p = .06 and p = .04 are completely different." The evidence barely differs. The difference between significant and not significant is not itself statistically significant (a point made by Gelman and Stern, 2006).
"If p > .05, the groups are the same." The study may simply have been too small to see a difference.
Try it
A permutation test shows what a p-value is by brute force. Take two made-up groups of recall scores. Under the null, the group labels do not matter, so reshuffle the labels thousands of times and see how often chance alone produces a difference as large as the one observed. That proportion is the p-value. The figure appears as an image when you run it.
Press Run (or Ctrl + Enter) to see the result here.
Program input · what you'd type while the program runs
Type the answers before you press Run, one per line. Each time the program reads a line (with input()), it gets the next line from this box.
Next, a simulation of a world where the null is true. We run 5,000 studies in which both groups come from the same population and record every p-value. If tests work as designed, about 5% should be below .05, and the p-values should be spread evenly from 0 to 1.
Press Run (or Ctrl + Enter) to see the result here.
Program input · what you'd type while the program runs
Type the answers before you press Run, one per line. Each time the program reads a line (with input()), it gets the next line from this box.
Check your understanding
Quick check · 5 questions
of 5 answered You scored / 5 · perfect!
-
1. A p-value is the probability of...
It is calculated assuming the null is true and describes how surprising the data would be. -
2. At alpha = .05, if there is truly no effect, what share of studies will be significant by luck?
Alpha is the long-run Type I error rate when the null is true. -
3. A result has p = .20 in a small study. What can you conclude?
Failing to reject the null is not evidence for it; small studies often miss real effects. -
4. Which statement about statistical significance is correct?
Significance depends on sample size as well as effect size. -
5. A Type II error is...
It is a miss: a real effect goes undetected.
Summary
- NHST asks how surprising your data would be if the null hypothesis were true; that probability is p.
- p is not the probability the null is true, not the probability of chance, and not effect size.
- Alpha = .05 is a convention; it sets the Type I error rate when the null is true.
- Statistical significance depends on sample size; practical importance depends on effect size.
- A permutation test builds a p-value by reshuffling labels.
Next: t-tests and effect sizes
Track your progress
Create a free account to tick off lessons and pick up where you left off on any device.
of Research Methods in Psychology lessons completed