


















Lesson 40 of 44 · Projects and Practice
Capstone Project: Simulate p-Hacking and Fix It
Use simulations to see how testing many outcomes or peeking at data inflates false positives, then fix the problem with a preregistered plan and corrections.
Reading that "flexible analysis inflates false positives" is one thing. Watching it happen in your own simulation is another, and it will change how you analyze data for good. In this project you will build a world where there is no real effect at all, run thousands of studies in it, and measure how often researchers armed with common, innocent-looking habits would still announce a "significant" discovery. Then you will apply the fixes.
What you will learn
- Why many outcomes, optional stopping and flexible exclusions inflate the false-positive rate.
- How to estimate the false-positive rate of an analysis strategy by simulation.
- How a correction (Bonferroni) or a fixed plan restores the nominal 5%.
- How to describe researcher degrees of freedom honestly in a report.
Key terms
Researcher degrees of freedom: the many choices (outcomes, exclusions, covariates, stopping rules) available during analysis.
Optional stopping: checking results repeatedly during data collection and stopping when p < .05.
Family-wise error rate: the probability of at least one false positive across a set of tests.
Bonferroni correction: dividing alpha by the number of tests (alpha / k) to hold the family-wise error rate near alpha.
Garden of forking paths: Gelman and Loken's image of the many analysis routes that could follow from a data set.
The arithmetic of many tests
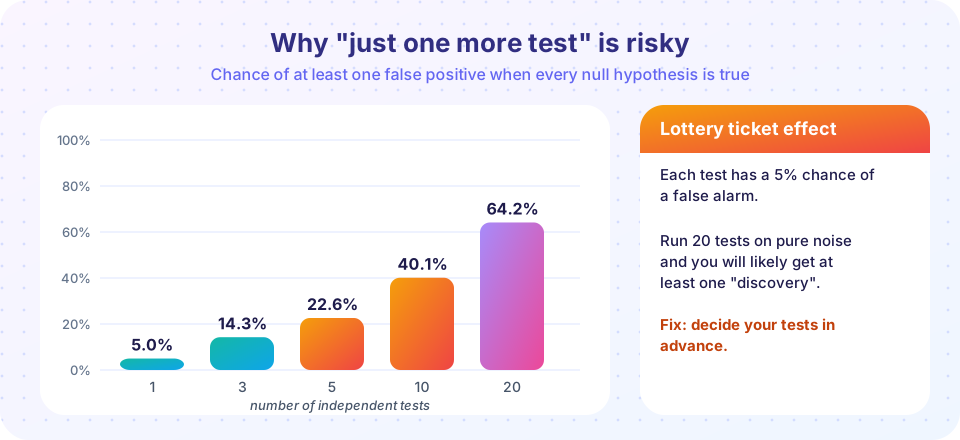
If every null hypothesis is true and you test k independent outcomes at alpha = .05, the chance of at least one significant result is 1 - 0.95^k. For one test that is 5%; for 3 tests 14.3%; for 5 tests 22.6%; for 10 tests 40.1%; for 20 tests 64.2%. That is the pattern in the picture. Real outcomes are often correlated, which makes the inflation somewhat smaller, but the direction is the same.
Another route to the same trap is optional stopping. A researcher tests ten people per group and, if p is not below .05, adds ten more, tests again, and so on. Every look is another chance for noise to cross the line. Simmons, Nelson and Simonsohn (2011) showed that combining several such flexible choices could push the false-positive rate far beyond 5%.
What the simulation will do
You will simulate studies with two groups drawn from the same population (the null is true by construction) and compare four strategies:
- One planned test (the honest baseline).
- Many outcomes, report "any significant".
- Optional stopping, peeking after every ten participants per group.
- Many outcomes with a Bonferroni correction.
The array operations below test all studies at once, so even 2,000 studies per strategy run quickly.
Try it
First, the multiple-outcomes strategy. For each number of outcomes k, 2,000 simulated studies compare two groups of 20 on k independent outcomes. We record how often at least one test is significant, with and without a Bonferroni correction.
Press Run (or Ctrl + Enter) to see the result here.
Program input · what you'd type while the program runs
Type the answers before you press Run, one per line. Each time the program reads a line (with input()), it gets the next line from this box.
Second, optional stopping. Each simulated study can "peek" after 10, 20, ..., 100 participants per group and stops as soon as p < .05. The chart compares the strategies.
Press Run (or Ctrl + Enter) to see the result here.
Program input · what you'd type while the program runs
Type the answers before you press Run, one per line. Each time the program reads a line (with input()), it gets the next line from this box.
What to take from it
Run the code a few times with different seeds. The planned single test stays near 5%. Flexible strategies climb far above it. Corrections bring it back down. That is the whole argument for preregistration: a preregistered plan removes the forking paths, so the stated 5% is the real 5%.
Important nuance: flexibility itself is not wrong. Exploration is how new hypotheses arise. The problem is reporting an exploratory path as though it had been planned. A trustworthy paper separates the two: "Our preregistered analysis found X; in an exploratory analysis we also noticed Y, which needs to be replicated."
Your project report
Write a short report (about 600 to 800 words) that includes:
- The question. How much does analysis flexibility inflate the false-positive rate?
- Method. Describe the simulation: data-generating process, sample sizes, strategies, number of simulated studies, random seed.
- Results. Report the false-positive rates in a table and one figure.
- Discussion. Explain the results in plain language, name two real research situations where each strategy might occur innocently, and list the remedies (preregistration, correction, larger samples, registered reports).
- Limitations. Real outcomes are correlated, real analysts have more or fewer options than the simulation, and normal data are an idealization.
An extension for ambitious students: add a fifth strategy, "drop outliers after seeing the data", where you exclude the single most extreme participant from each group if the first test is not significant, and measure what happens.
Common misconceptions
"p-hacking needs bad intentions." Most inflation comes from honest, unplanned choices made after seeing data, which is why a written plan is the remedy.
"A correction makes the study useless." Corrections cost some power but protect against false findings. Choosing fewer, better-justified outcomes in advance helps both.
"Peeking is always wrong." Sequential designs with proper adjustments allow planned interim looks. Unplanned, unadjusted peeking is the problem.
Check your understanding
Quick check · 5 questions
of 5 answered You scored / 5 · perfect!
-
1. With 10 independent outcomes and all null hypotheses true, about how likely is at least one p < .05?
1 - 0.95^10 is about 40%. -
2. Why does optional stopping inflate false positives?
Repeated testing multiplies opportunities for a false positive. -
3. What does a Bonferroni correction do?
Using alpha/k keeps the family-wise error rate near alpha. -
4. What does preregistration add to this picture?
Fixing the plan beforehand removes researcher degrees of freedom. -
5. Which sentence in a paper is the most honest?
It separates confirmatory from exploratory findings.
Summary
- With a true null, testing k outcomes gives about 1 - 0.95^k chance of a false positive; peeking at data adds to it.
- Simulation lets you measure the false-positive rate of any analysis strategy.
- Corrections, preregistration and fixed stopping rules restore the nominal 5%.
- Report confirmatory and exploratory analyses separately.
Track your progress
Create a free account to tick off lessons and pick up where you left off on any device.
of Research Methods in Psychology lessons completed