


















Lesson 28 of 44 · Statistics for Psychologists
t-Tests and Effect Sizes
Compare two means with independent and paired t-tests, compute Cohen's d and a confidence interval, and learn why effect sizes matter more than p-values alone.
The workhorse test of experimental psychology is the t-test, which compares the means of two conditions. It was invented not by a psychologist but by a brewer: William Sealy Gosset, who worked for the Guinness brewery in Dublin and, because the company discouraged staff from publishing, wrote under the pen name "Student". In 1908 he solved the problem of drawing conclusions from the tiny samples a brewer can afford. A century later, almost every experiment with two groups still ends in a t-test, and the best-practice partner to its p-value is an effect size.
What you will learn
- How the independent-samples and paired t-tests work and when to use each.
- How to compute and interpret Cohen's d.
- What a confidence interval adds to a p-value.
- Why "small", "medium" and "large" need context.
- How a large sample can make a tiny effect significant.
Key terms
t statistic: the difference between means divided by its standard error; it says how many standard errors apart the means are.
Degrees of freedom (df): a number that shapes the t distribution; for an independent two-group test it is n1 + n2 - 2.
Cohen's d: the difference between means divided by the pooled standard deviation.
Confidence interval (CI): a range of plausible values for the true difference; a 95% CI is built by a procedure that captures the true value in 95% of repetitions.
Welch's t-test: a version of the t-test that does not assume equal variances.
Comparing two groups
Take two conditions. The numerator of the t statistic is the difference between the means. The denominator is the standard error of that difference, the typical size of the sampling wobble:
t = (M1 - M2) / SE, where SE grows with the spread of scores and shrinks with the square root of the sample size.
So t is large when the difference is large compared with the noise. Software converts t and its degrees of freedom into a p-value using the t distribution, which has slightly fatter tails than the normal curve for small samples (the correction Gosset worked out).
Which test do you use?
- Independent-samples t-test: two different groups, as in a between-subjects design.
- Paired-samples t-test: the same people measured twice, or matched pairs, as in a within-subjects design. It tests whether the average of the differences is zero.
- One-sample t-test: compare one group's mean with a fixed value.
Assumptions: the observations are independent of one another (the most serious one; people in the same classroom are not independent), the scores are roughly normally distributed within each group (matters little with n above about 30), and for the classic independent test the variances are similar. Many statisticians recommend using Welch's version by default because it protects you when the variances differ and costs almost nothing when they do not.
Effect size: how big is the difference?
The p-value reflects both the effect and the sample size. To describe the size of the effect on its own, use an effect-size statistic. For two means the standard choice is Cohen's d:
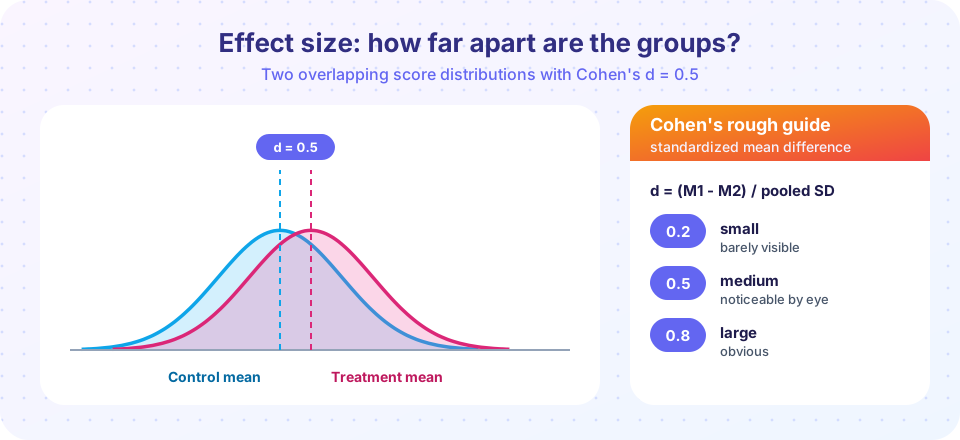
d = (M1 - M2) / pooled SD
Because d is in standard-deviation units, it does not depend on the scale of the measure: a d of 0.5 means the group means are half a standard deviation apart whether you measured reaction time in milliseconds or anxiety on a 20-point scale. Jacob Cohen's 1988 handbook suggested rough anchors of 0.2 (small), 0.5 (medium) and 0.8 (large). He meant them as a last resort when you know nothing else about the field.
A d of 0.5 has a concrete meaning. Imagine picking one person at random from each group; the person from the higher group scores higher about 64% of the time (under normality). That is a visible but modest edge, which is why a "medium" effect is usually invisible to the naked eye in a crowd.
Other effect sizes you will meet: r (correlation) for relationships, eta squared or partial eta squared for the share of variance explained in ANOVA, and odds ratios for binary outcomes. The labels "small, medium and large" differ for each, and what counts as meaningful depends on the topic: a tiny change in the risk of a serious illness may matter more than a large change in a trivial score.
Confidence intervals
A p-value only says whether zero is a plausible value. A 95% confidence interval for the difference shows the whole range of plausible values. If the interval for a difference in means runs from 0.4 to 5.6 points, the data are compatible with a small effect or a fairly large one, which is much more honest than a lone "p = .03". Intervals also reveal the opposite situation: a non-significant result whose interval stretches from -6 to +8 is simply uninformative, while one running from -0.5 to +0.5 is genuinely evidence that any effect is small.
The right interpretation is subtle: the 95% describes the long-run performance of the procedure, not the probability that this particular interval contains the truth.
Big samples, tiny effects
Because t grows with the square root of the sample size, any nonzero effect becomes significant if the sample is large enough. For a fixed small effect of d = 0.1, the expected t grows steadily as n rises. The calculation below shows it. This is why modern reporting standards (APA Style among them) ask for effect sizes and intervals alongside p-values.
Common misconceptions
"Cohen's thresholds are rules." They are rules of thumb. In some fields d = 0.2 is a big deal; in others d = 0.8 is routine.
"A significant t-test shows the effect is large." It shows the effect is unlikely to be exactly zero. Size is a separate matter.
"A 95% CI means a 95% chance the truth lies in it." The 95% refers to the method's long-run coverage, although in practice reading it as a range of plausible values is a reasonable shortcut.
Try it
A worked analysis of the same made-up recall scores as in the previous lesson: an independent t-test (Welch's), Cohen's d and a 95% confidence interval for the difference. The code computes the interval by hand, so you can see every ingredient.
Press Run (or Ctrl + Enter) to see the result here.
Program input · what you'd type while the program runs
Type the answers before you press Run, one per line. Each time the program reads a line (with input()), it gets the next line from this box.
The next calculation shows the "big samples, tiny effects" problem. For a true effect of d = 0.1 (tiny by any standard), it computes the approximate p-value you would expect at different sample sizes per group. It is a calculation based on the t distribution, not a simulation.
Press Run (or Ctrl + Enter) to see the result here.
Program input · what you'd type while the program runs
Type the answers before you press Run, one per line. Each time the program reads a line (with input()), it gets the next line from this box.
Check your understanding
Quick check · 6 questions
of 6 answered You scored / 6 · perfect!
-
1. Which test fits a within-subjects design with two conditions?
The same people are measured twice, so the paired test, which works on the differences, is appropriate. -
2. Cohen's d = 0.5 means that...
d is the difference in means expressed in pooled standard deviation units. -
3. Who developed the t-test while working for a brewery?
Gosset published under the pseudonym Student because Guinness restricted staff publications. -
4. A confidence interval for a difference runs from -0.5 to +8.2 points. What can you say?
The interval includes zero, so the data do not rule out no effect, but they also fit large effects: the study is imprecise. -
5. Why does a huge sample make a trivial effect significant?
The standard error falls with the square root of n, so the same difference yields a larger t. -
6. Which assumption of the t-test is the most serious to violate?
Dependent observations, such as people in the same class, can seriously distort p-values.
Summary
- A t-test divides a difference in means by its standard error; use independent, paired or one-sample versions as the design requires, with Welch's version as a safe default.
- Cohen's d expresses the difference in standard-deviation units; the 0.2, 0.5, 0.8 anchors are rough guides.
- Confidence intervals show the range of plausible differences and reveal imprecision.
- Large samples make tiny effects significant, so always report an effect size and an interval.
Next: Power and sample size
Track your progress
Create a free account to tick off lessons and pick up where you left off on any device.
of Research Methods in Psychology lessons completed