


















Lesson 38 of 47 · Data Analysis and Projects
Chapter overview: data analysis
How to turn simulation output and measurements into results you can defend: fits, uncertainties, spectra and honest reporting, with a map of the chapter.
A simulation or an experiment ends with numbers. The numbers alone prove nothing: you must decide what they mean, how precisely you know them, and whether your model really describes them. This chapter covers the working toolkit physicists use for that last step: fitting models to data, putting honest error bars on the result, and finding the frequencies hidden in a signal.
What you will learn
- The four stages of analyzing data.
- Why every result needs an uncertainty, and where uncertainties come from.
- The difference between statistical and systematic errors.
- What the next lessons teach.
Key terms
Statistical error: scatter from random fluctuations; it shrinks as 1/√N when you take more data.
Systematic error: a bias that does not average away (a miscalibrated ruler, a too-large time step).
Residual: data minus model for one point.
Chi-square (χ²): the sum of squared residuals measured in units of the uncertainty.
Spectrum: the strength of each frequency component of a signal.
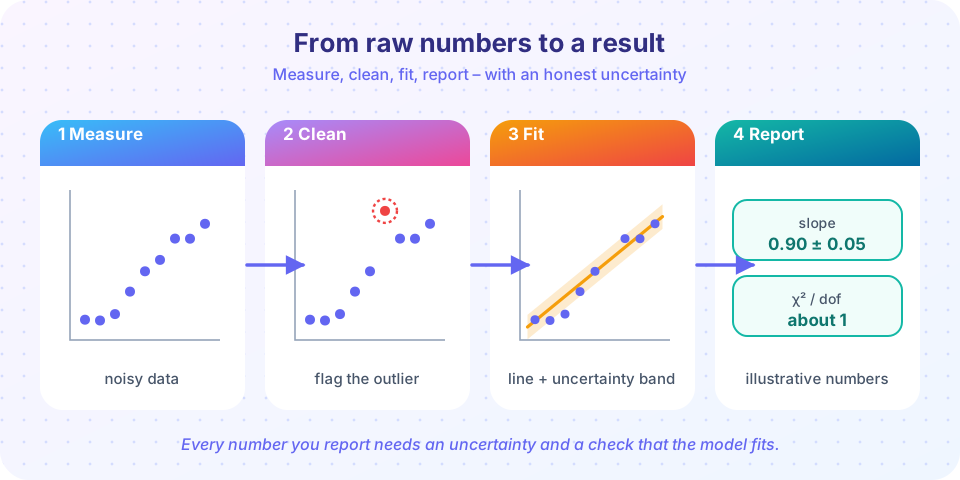
Four stages
1. Measure. In simulation this means recording observables every so many steps; in experiment, reading an instrument. Record the uncertainty of each number along with the number itself.
2. Clean. Look at the data before fitting it. Remove the part of a simulation that is still equilibrating. Flag points that are clearly wrong, but record why; deleting data because "it does not fit" is not cleaning, it is cheating.
3. Fit. Choose a model with parameters and find the parameter values that make the model agree best with the data. A good fit has residuals that look like random noise.
4. Report. Quote the value with its uncertainty and unit, the number of data points, the method, and a plot of data and model together. If a reader cannot reproduce your number, it is not yet a result.
Where uncertainties come from
In a simulation: statistical noise (finite run length), discretization (grid spacing, time step), finite-size effects (box too small) and model limits (the potential is only an approximation). In an experiment: instrument resolution, calibration, background. A careful analysis names each source and estimates its size. Mixed-up error types are a frequent reason for wrong conclusions: a very long simulation can reduce the statistical error to nothing while a poor time step keeps a large systematic error.
Why analysis matters
Fitting
Spectra
Reporting
What each lesson covers
- Fitting models to data: least squares, weights, χ², parameter uncertainties and the bootstrap.
- Fourier analysis of signals: the FFT, frequency resolution, aliasing and windows.
- Chapter 8 review: a one-page picture and ten questions.
Try it
The average of N independent measurements has an uncertainty σ/√N. Check that claim by simulation: we repeat an experiment many times and look at the scatter of the averages.
Press Run (or Ctrl + Enter) to see the result here.
Program input · what you'd type while the program runs
Type the answers before you press Run, one per line. Each time the program reads a line (with input()), it gets the next line from this box.
Systematic errors behave differently. Here a clock that runs 1 percent fast biases every measurement, and averaging does nothing to remove it.
Press Run (or Ctrl + Enter) to see the result here.
Program input · what you'd type while the program runs
Type the answers before you press Run, one per line. Each time the program reads a line (with input()), it gets the next line from this box.
Check your understanding
Quick check · 4 questions
of 4 answered You scored / 4 · perfect!
-
1. How does the statistical uncertainty of an average change if you take 100 times more data?
The uncertainty scales like 1/√N; √100 = 10. -
2. Which of these is a systematic error?
A biased tool shifts every measurement in the same direction; averaging does not remove it. -
3. What should the residuals of a good fit look like?
Structure in the residuals means the model is missing something. -
4. Which is the best way to handle an outlier?
Transparent handling keeps the analysis honest and reproducible.
Summary
- Analysis has four stages: measure, clean, fit, report.
- Statistical errors shrink like
1/√N; systematic errors do not. - A good fit leaves residuals that look like noise.
- Always report a value with its uncertainty and a plot of data with the model.
Next: Fitting models to data
Track your progress
Create a free account to tick off lessons and pick up where you left off on any device.
of Computational Physics lessons completed