


















Lesson 40 of 47 · Data Analysis and Projects
Fourier analysis of signals
Find the frequencies hidden in a noisy signal with the FFT. Learn frequency resolution, the Nyquist limit, aliasing and window functions with checked examples.
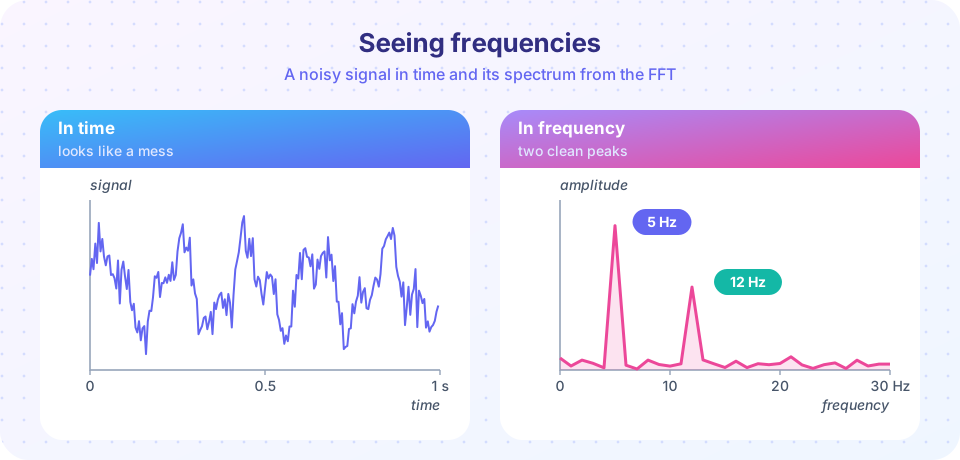
A trajectory from a molecular dynamics run, the voltage from a sensor, the light from a distant star: all are signals that vary in time, and the interesting physics is often in their rhythms. A swinging pendulum has one dominant frequency. A vibrating molecule has several. A time series of atomic positions in a crystal contains the sound waves of the whole lattice. The Fourier transform converts a signal from "value against time" to "strength against frequency", and the FFT (fast Fourier transform) computes it in a flash.
What you will learn
- What the discrete Fourier transform computes and how to scale it to real amplitudes.
- How record length and sampling rate set the frequency resolution and the highest usable frequency.
- What aliasing is and how to avoid it.
- Why windows reduce spectral leakage.
Key terms
Sampling rate (f_s): number of samples per second.
Nyquist frequency: f_s / 2, the highest frequency the samples can represent.
Frequency resolution: Δf = 1/T for a record of duration T.
Aliasing: a frequency above Nyquist shows up falsely at a lower frequency.
Spectral leakage: spreading of a peak's energy into neighboring bins, caused by cutting the signal off abruptly.
The discrete Fourier transform
For N samples x_n taken at times t_n = n/f_s, the discrete Fourier transform is
X_k = Σ_{n=0}^{N−1} x_n · exp(−2πi k n / N), k = 0, 1, …, N−1
Bin k corresponds to frequency f_k = k·f_s/N. For a real signal the upper half mirrors the lower half, so we keep only k = 0 … N/2 (NumPy's rfft). A pure sine of amplitude A and a frequency that fits exactly on a bin gives |X_k| = A·N/2, so the amplitude spectrum is 2|X_k|/N (and |X_0|/N for the zero-frequency bin).
The naive sum costs N² operations. The FFT algorithm (Cooley and Tukey, 1965, though Gauss had the idea around 1805) needs only N log N: for a million samples that is 20 million operations instead of a trillion.
Two numbers rule everything
- Frequency resolution
Δf = 1/T. To tell two tones 0.5 Hz apart you need at least 2 seconds of data. More samples at the same duration do not help; a longer record does. - Highest frequency
f_s/2. Sample faster than twice the highest frequency present.
Aliasing
Sampling a 9 Hz sine at 12 samples per second gives points that are indistinguishable from a 3 Hz sine (with the sign flipped): the 9 Hz peak folds around the Nyquist frequency 6 Hz to 12 − 9 = 3 Hz. Once sampled, the information is gone. The cure is to filter out high frequencies before sampling (an anti-aliasing filter) or to sample faster. In a simulation that stores positions every n steps, the effective sampling rate is 1/(n·Δt), so storing too rarely can alias molecular vibrations into false slow motions.
Windows and leakage
The DFT assumes that the record repeats forever. If the record does not contain a whole number of cycles, the end does not match the start, and the jump spreads the peak's energy over many bins. Multiplying the data by a smooth window that tapers to zero at both ends (such as the Hann window 0.5(1 − cos(2πn/(N−1)))) removes the jump. The price is a slightly wider main peak and a reduced amplitude (the Hann window has mean 0.5, so divide by 0.5 to restore the scale).
Common misconceptions
- "The spectrum tells you when a frequency occurs." The ordinary FFT of the whole record says which frequencies are present, not when. For that you need a spectrogram (a sequence of short FFTs).
- "More zero padding gives more resolution." Padding interpolates the spectrum and makes the plot smoother, but the true resolution stays
1/T. - "Aliasing is a software bug." It is a property of sampling; the data already lost the information.
- "Higher FFT bins are always noise." Real peaks can sit anywhere up to the Nyquist frequency.
Try it
A synthetic signal with two tones (5 Hz amplitude 1 and 12 Hz amplitude 0.6) plus noise, sampled at 200 Hz for 1 s. We compute the amplitude spectrum and pick the peaks.
Press Run (or Ctrl + Enter) to see the result here.
Program input · what you'd type while the program runs
Type the answers before you press Run, one per line. Each time the program reads a line (with input()), it gets the next line from this box.
Now aliasing. A 9 Hz sine sampled at 12 Hz appears at 3 Hz; sampled at 40 Hz it appears correctly.
Press Run (or Ctrl + Enter) to see the result here.
Program input · what you'd type while the program runs
Type the answers before you press Run, one per line. Each time the program reads a line (with input()), it gets the next line from this box.
Last, leakage. A 10.5 Hz tone in a 1 s record does not complete whole cycles. We compare a rectangular window (no window) with a Hann window.
Press Run (or Ctrl + Enter) to see the result here.
Program input · what you'd type while the program runs
Type the answers before you press Run, one per line. Each time the program reads a line (with input()), it gets the next line from this box.
Both peaks read below the true value 1 because the tone sits between two frequency bins (the "scalloping" loss). The Hann window is closer to the truth, and far from the peak it is hundreds of times quieter than the rectangular window.
Check your understanding
Quick check · 5 questions
of 5 answered You scored / 5 · perfect!
-
1. A signal is sampled at 500 Hz for 4 seconds. What is the frequency resolution?
Δf = 1/T = 1/4 = 0.25 Hz; the sampling rate does not change it. -
2. What is the highest frequency representable when sampling at 500 Hz?
The Nyquist frequency is f_s/2 = 250 Hz. -
3. A 70 Hz tone is sampled at 100 Hz. Where does it appear?
70 Hz is above Nyquist (50 Hz); it folds to |100 − 70| = 30 Hz. -
4. What does a Hann window do?
A smooth taper removes the artificial jump at the edges, so energy does not leak across bins. -
5. How many operations does the FFT need for N samples?
The Cooley-Tukey FFT scales as N log N, versus N² for the direct sum.
Summary
- The DFT turns N samples into N frequency bins; for real signals use
rfftand scale amplitude by2|X|/N. - Resolution is
Δf = 1/T; the highest representable frequency isf_s/2. - Frequencies above Nyquist alias to lower ones: sample faster or filter first.
- Windows such as Hann reduce leakage at the cost of a slightly wider peak.
Next: Chapter 8 review
Track your progress
Create a free account to tick off lessons and pick up where you left off on any device.
of Computational Physics lessons completed