


















Lesson 6 of 46 · Signals and Spectra
Chapter 2 overview: Signals and spectra
Preview chapter 2: why engineers look at signals in frequency, what the Fourier series and transform do, and how spectra explain bandwidth and filtering.
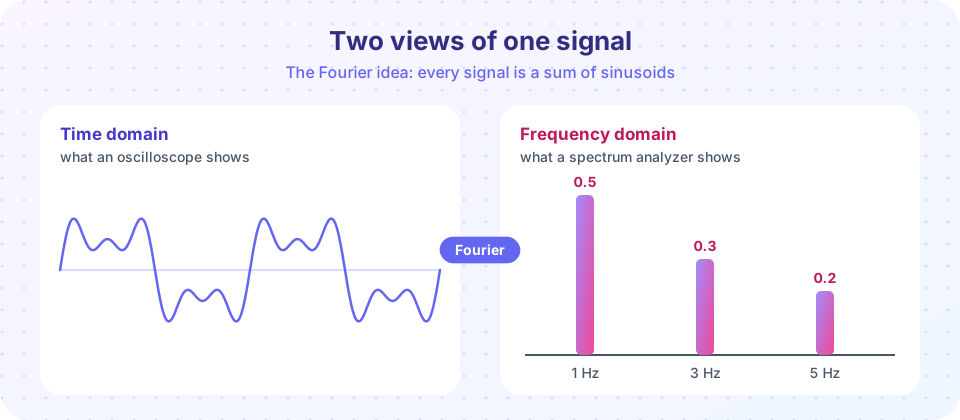
An oscilloscope shows a signal against time. A spectrum analyzer shows the same signal against frequency. Both views contain exactly the same information, but each makes different questions easy. In the time view you see the shape of a pulse; in the frequency view you see how much bandwidth it needs, and what a filter will do to it.
What you will learn
- Why the frequency domain is the natural language of communication systems.
- What each lesson of this chapter will teach, and how they connect.
- How to compute a simple spectrum with a few lines of code.
Key terms
- Time domain: describing a signal by its value at each instant,
x(t). - Frequency domain: describing a signal by the amplitude and phase of its sinusoidal components.
- Spectrum: the plot of those amplitudes (and phases) against frequency.
- Fourier analysis: the mathematics that moves between the two views.
Why frequency?
Sinusoids have a magical property: send a sine wave through any linear, time-invariant system (a cable, a filter, an amplifier operating linearly) and what comes out is a sine wave of the same frequency, only scaled in amplitude and shifted in phase. Nothing else behaves so simply. Joseph Fourier's insight, published in 1822 in his work on heat, was that almost any signal can be written as a sum of sinusoids. So to find the output of a system for a complicated input, you break the input into sinusoids, apply the scaling and shift to each one, and add them back.
In communications that is not a mathematical curiosity but a daily need. A channel has a frequency response; a radio station owns a band of frequencies; a modulator moves a spectrum from one place to another. All of those statements live in the frequency domain.
The chapter in slides
Chapter 2 at a glance
Series
Transform
Filters
The lessons in this chapter
- Fourier series: periodic signals as sums of harmonics; the square wave; Parseval's relation.
- Fourier transform: finite-energy signals; the pulse and the sinc; the properties you will use for modulation.
- Power spectral density: where a signal's power sits, how filters reshape it, and distortionless transmission.
- Chapter 2 review: a one-page summary and a ten-question check.
Common misconceptions
"The spectrum is a different signal." It is the same signal, described differently. No information is created or destroyed.
"Negative frequencies are not real." They are a mathematical convenience from using complex exponentials; a real signal's spectrum is symmetric, so negative frequencies mirror the positive ones.
Try it
The first example builds the signal of the illustration above and recovers its three components from the samples with the fast Fourier transform (FFT). The signal contains a whole number of cycles in the 1 s window, so each peak is exact.
Press Run (or Ctrl + Enter) to see the result here.
Program input · what you'd type while the program runs
Type the answers before you press Run, one per line. Each time the program reads a line (with input()), it gets the next line from this box.
The second example shows what the transform does, using no libraries: a direct discrete Fourier transform of 16 samples, written out so that you can see each sum.
Press Run (or Ctrl + Enter) to see the console output here.
No output.
Check your understanding
Quick check · 4 questions
of 4 answered You scored / 4 · perfect!
-
1. What comes out of a linear time-invariant system when a sine wave goes in?
This property of LTI systems is why frequency analysis is so powerful. -
2. The spectrum of a signal is
The time and frequency views are equivalent descriptions of one signal. -
3. Who showed that heat flow problems could be solved with sums of sinusoids?
Joseph Fourier introduced the method in his 1822 work on heat. -
4. Why does the 1 s example show exact peaks?
When every component has a whole number of cycles in the window, no spectral leakage occurs.
Summary
- The time and frequency domains describe one signal in two ways.
- Sinusoids pass through linear systems unchanged in shape, so spectra make filters easy to analyze.
- This chapter covers the Fourier series, the Fourier transform, power spectral density and filters.
Next: Fourier series
Track your progress
Create a free account to tick off lessons and pick up where you left off on any device.
of Communication Systems lessons completed