


















Lesson 28 of 46 · Noise and Error Performance
The Matched Filter and Optimal Detection
Derive why the matched filter maximizes SNR (2E/N0), how a correlator equals it, how decision thresholds work, and where the Q-function and BPSK error rate come from.
A pulse arrives buried in noise. You know exactly what pulse shape you are looking for; you do not know whether it was sent, or with what sign. What is the best way to process the waveform so that the decision at the end is as reliable as possible?
The answer is the matched filter, found by D. O. North in 1943 for radar. It is a filter whose impulse response is a time-reversed copy of the pulse. At the sampling instant it gives the largest possible signal-to-noise ratio, and the ratio depends only on the pulse energy, not on its shape. That single result explains why Eb/N0 is the master variable of digital communications.
What you will learn
- State the matched filter and show its peak SNR equals
2E/N0. - Explain why a correlator and a matched filter give the same decision value.
- Derive the BPSK error rate
Q(√(2·Eb/N0))from a Gaussian decision statistic. - Use the Q-function and relate it to
erfc. - Explain how unequal prior probabilities move the threshold.
Key terms
- Matched filter: filter with impulse response
h(t) = s(T − t). - Correlator: multiply by the expected pulse and integrate; equivalent to a matched filter sampled at
T. - Decision statistic: the single number
zcompared with a threshold. - Q-function:
Q(x) = P(N(0,1) > x), the tail probability of the standard normal. - ML detector: picks the symbol that makes the received data most likely.
The matched filter
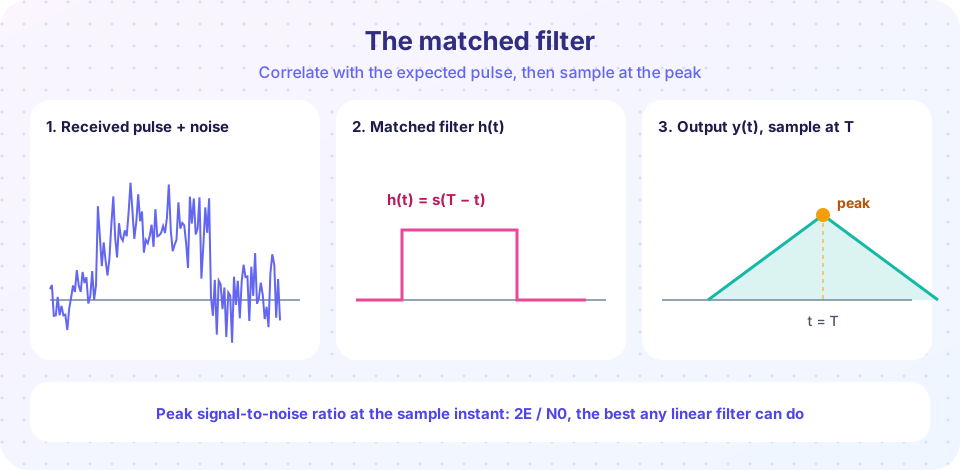
The receiver filters r(t) = s(t) + n(t) with some filter h(t) and samples at time T. The signal part gives y_s = ∫ s(τ) h(T − τ) dτ. The noise part is Gaussian with variance (N0/2) · ∫ h²(t) dt. The ratio of signal power to noise power is largest when h(t) is proportional to s(T − t), which follows from the Cauchy-Schwarz inequality. With that choice
peak SNR = 2E / N0, where E = ∫ s²(t) dt is the pulse energy.
Two things stand out. The result contains no pulse shape, only energy, so a tall short pulse and a low long pulse of the same energy do equally well. And it contains no bandwidth: what counts is energy divided by noise density. If you double the pulse energy, you gain 3 dB.
The output of the matched filter for a rectangular pulse is a triangle that peaks at t = T, exactly as in the figure; that is the instant to sample.
Correlator receiver
Rather than building a filter, the receiver can compute z = ∫₀ᵀ r(t)·s(t) dt directly: multiply by the reference pulse and integrate. For a pulse of energy E in noise this gives
z = ±E + n, with n ~ N(0, (N0/2)·E).
Dividing by √E normalizes it to z' = ±√E + n' with noise variance N0/2, the form used for BPSK in the previous chapter. The correlator and the matched filter sampled at T produce identical numbers; engineers choose whichever is easier to build.
From a Gaussian statistic to the error rate
For BPSK the normalized decision statistic is z = +√Eb + n for bit 1 and z = −√Eb + n for bit 0, with n Gaussian of mean 0 and variance σ² = N0/2. With equal priors, the best threshold is zero by symmetry. A bit 1 is mistaken for 0 when n < −√Eb:
Pb = P(n > √Eb) = Q(√Eb / σ) = Q(√(2·Eb/N0)).
The Q-function is the area under the right tail of the standard normal curve:
Q(x) = (1/√(2π)) · ∫ₓ^∞ e^(−u²/2) du = ½ · erfc(x/√2).
So Pb = ½·erfc(√(Eb/N0)). Useful values: Q(0) = 0.5, Q(1) ≈ 0.159, Q(2) ≈ 0.0228, Q(3) ≈ 0.00135, Q(4) ≈ 3.2 × 10⁻⁵. Because the Gaussian tail dies off extremely fast, a small increase in Eb/N0 causes a large drop in BER; that is the waterfall you will see in the next lesson.
Thresholds and prior probabilities
The zero threshold is optimal only when 0 and 1 are equally likely. If a bit 1 is sent with probability P1 and a bit 0 with P0, the maximum a posteriori (MAP) threshold becomes
λ = (N0 / (4·√Eb)) · ln(P0 / P1).
If zeros are more common (P0 > P1), the threshold moves toward the "1" point so that the more probable symbol gets the larger decision region. Compressed data is close to equal-probability, so most systems use zero.
Common misconceptions
- "A matched filter is one that matches the channel bandwidth." It matches the pulse shape, not the bandwidth.
- "A bigger pulse amplitude is the only way to improve detection." Pulse energy is what counts, so a longer pulse works too, at the cost of a lower bit rate.
- "The Q-function is a different kind of function from erfc." They are the same thing in different units:
Q(x) = ½·erfc(x/√2). - "With a matched filter there are no errors." It gives the best possible SNR, not a zero error rate; errors still happen whenever noise exceeds the margin, and at 0 dB they are frequent.
Try it
First, compare the matched filter with two mismatched filters (half as long, and twice as long). The simulation measures the output SNR at the best sampling instant and compares it with the theory 2E/N0.
Press Run (or Ctrl + Enter) to see the result here.
Program input · what you'd type while the program runs
Type the answers before you press Run, one per line. Each time the program reads a line (with input()), it gets the next line from this box.
Second, see where the error probability comes from. Plot the two Gaussian bell curves of the decision statistic and shade the error area. The printed numbers compare a Monte Carlo count with the formula.
Press Run (or Ctrl + Enter) to see the result here.
Program input · what you'd type while the program runs
Type the answers before you press Run, one per line. Each time the program reads a line (with input()), it gets the next line from this box.
Check your understanding
Quick check · 6 questions
of 6 answered You scored / 6 · perfect!
-
1. What is the peak signal-to-noise ratio at the output of a matched filter for a pulse of energy E in noise of density N0?
The matched filter achieves SNR = 2E/N0, the maximum for any linear filter. -
2. A rectangular pulse of length T enters a matched filter. What does the output look like?
Convolving a rectangle with its time reversal gives a triangle, peaking at the sample instant. -
3. What is the relationship between the Q-function and erfc?
Q(x) = ½·erfc(x/√2), so Q(√(2γ)) = ½·erfc(√γ). -
4. Two pulses of different shape have the same energy. In the same noise, their matched-filter peak SNR is:
Peak SNR depends only on energy: 2E/N0. -
5. If zeros are more probable than ones in a BPSK stream, where should the optimal threshold move?
MAP detection gives more room to the more probable symbol. -
6. Q(2) is about 0.0228. What is the BPSK error probability at Eb/N0 = 2 (that is, √(2·Eb/N0) = 2)?
With Eb/N0 = 2 (3 dB), Pb = Q(√4) = Q(2) ≈ 0.0228.
Summary
- The matched filter
h(t) = s(T − t)maximizes the sampled SNR to2E/N0, independent of pulse shape. - A correlator (multiply by the pulse and integrate) gives the same decision value.
- With a Gaussian decision statistic, BPSK errors have probability
Q(√(2·Eb/N0)) = ½·erfc(√(Eb/N0)). - Unequal priors move the optimal threshold so that the more probable symbol gets the larger decision region.
Next: Bit error rate curves
Track your progress
Create a free account to tick off lessons and pick up where you left off on any device.
of Communication Systems lessons completed