


















Lesson 3 of 49 · Getting Started
The OR Modelling Process: From Problem to Decision
Follow the six stages of an operations research study, from defining the problem and collecting data to validating the model and putting results to work.
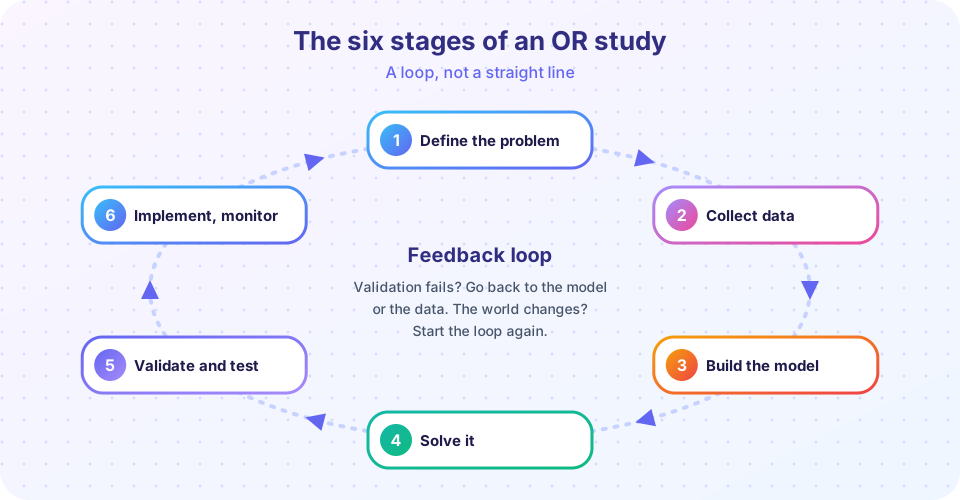
A common surprise for newcomers is that solving the model is only one step of an OR project, and often the shortest one. Most of the effort goes into understanding the problem, finding trustworthy data and checking that the answer deserves to be believed. Experienced practitioners follow a loop with six stages. In this lesson you will walk the loop with Sunrise Bakery and see where studies usually go wrong.
What you will learn
- The six stages of an OR study and what each one produces.
- How to state a problem so that it can be modelled.
- Three ways to validate a model before trusting it.
- Why a study is a loop, not a straight line.
Key terms
Stakeholder: a person who is affected by the decision or who must act on it.
Assumption: a simplification you accept while building the model.
Validation: checking that the model reproduces reality well enough for its purpose.
Sensitivity analysis: testing how the answer changes when inputs change.
Implementation: putting the recommended decision into practice.
Stage 1: define the problem
Good studies start with a question, not a technique. Ask who decides, what can be changed, what counts as success and what must never happen. A vague wish ("improve the bakery") becomes a precise question: "How many cake batches and bread batches should we bake each day to maximize daily profit, given 16 oven hours and 14 baker hours?"
Write down:
- the decision (the things you control),
- the objective (one measure, or a clear ranking of several),
- the limits (resources, rules, deadlines),
- the scope (what is inside the study and what is not).
Talk to stakeholders. The baker knows that the oven needs 30 minutes to warm up, which is a hidden limit no spreadsheet would show.
Stage 2: collect data
A model needs numbers: profits per batch, hours per batch, capacities, demand. Take them from records and measurements. Check their quality: units, missing values, outliers and whether they describe the same period. Where a number is uncertain, record a range rather than a single value, because Stage 5 will test it.
For the bakery, the owner times the oven use of a cake batch over five days and gets 2.1, 1.9, 2.0, 2.2 and 1.8 hours. The mean is 2.0 hours; the model uses 2.0 but remembers that the real value varies by about 0.2.
Press Run (or Ctrl + Enter) to see the result here.
Program input · what you'd type while the program runs
Type the answers before you press Run, one per line. Each time the program reads a line (with input()), it gets the next line from this box.
Stage 3: build the model
A model translates the problem into mathematics: variables, an objective function and constraints. For the bakery, let x be cake batches and y bread batches:
maximize   60x + 40y            (profit in dollars)
subject to 2x +  y ≤ 16         (oven hours)
            x + 2y ≤ 14         (baker hours)
            x, y ≥ 0
Every model makes assumptions. Here, profit per batch is constant, hours per batch are constant, and everything baked is sold. Write the assumptions down; they are the first place to look when the answer seems strange. Start with the simplest model that captures the main trade-off, then refine. Chapter 2 is entirely about this stage.
Stage 4: solve the model
Choose a method that fits the model. Small linear programs can be solved by hand or with the simplex method (Chapter 3), network problems with specialized algorithms (Chapter 4), and very hard problems with heuristics that give good answers quickly (Chapter 8). The result of this stage is a recommended decision and its objective value. For the bakery: 6 cake batches, 4 bread batches, profit $520.
Stage 5: validate and test
Never trust an answer before you test the model. Three practical checks:
- Face validity. Show the results to people who know the system. Do they find the answer plausible? If the model says the bakery should bake nothing on Saturday, the baker will tell you why that is wrong.
- Historical test. Feed last month's data into the model and compare its output with what really happened.
- Sensitivity analysis. Change the inputs a little and see whether the decision changes. A plan that collapses when one number moves by 5% is fragile.
Press Run (or Ctrl + Enter) to see the result here.
Program input · what you'd type while the program runs
Type the answers before you press Run, one per line. Each time the program reads a line (with input()), it gets the next line from this box.
Run it and read the table: if a small change in the data makes the best plan jump to a very different one, you need better data or a more careful decision rule.
Stage 6: implement and monitor
A beautiful plan that nobody follows has no value. Implementation includes explaining the result in plain language, training the people who use it, building a tool (a spreadsheet, a dashboard, a scheduling program) and agreeing how the model will be updated. After implementation the world changes: prices move, a new oven arrives. Monitor the results and return to Stage 1 when the situation no longer matches the model.
Why it is a loop
Studies rarely run in a straight line. Validation may reveal a missing constraint, which sends you back to the model. Solving may show that the data are too uncertain, which sends you back to data collection. The real value often appears in the second or third lap, when stakeholders see a first result and say, "Ah, but we also have to...".
A worked mini-study
Here is the loop in one paragraph for the bakery.
- Define: choose daily batches to maximize profit.
- Data: oven 16 h, baker 14 h, profits $60 and $40, hours per batch from timing.
- Model: the two-variable program above.
- Solve: best plan (6, 4), profit $520.
- Validate: the baker says that a 6-and-4 day is realistic; sensitivity shows the plan changes if cakes take more oven time than expected.
- Implement: the owner prints a daily plan sheet and revisits it monthly.
Typical pitfalls
Studies fail in recognizable ways, and knowing them helps you avoid them.
- Solving the wrong problem. The team optimizes delivery cost, but the customers care about delivery time. Confirm the objective with the people who will judge the result.
- Dirty data. A single mistyped capacity can make a plan impossible. Plot or tabulate every input before using it.
- Over-modelling. A model with every detail takes months to build and nobody can explain it. Start simple and add only what changes the decision.
- Ignoring the people. If the baker was never asked, the plan may ignore the 30 minutes the oven needs to warm up, and the baker will quietly ignore the plan.
- One-shot thinking. A model is a tool for repeated use. Plan how it will be updated when prices and capacities change.
Common misconceptions
"The solving stage is the hard part." For most real studies the hard parts are asking the right question and getting good data.
"If the model matches the data it is correct." A model can fit past data and still fail for new situations. Test it on data it has not seen.
"Implementation is someone else's job." Studies that ignore the people who must use them are the ones that fail.
Check your understanding
Quick check · 5 questions
of 5 answered You scored / 5 · perfect!
-
1. What is the first stage of an OR study?
You must know what decision is being made, the goal and the limits before any model can be built. -
2. What does sensitivity analysis test?
Sensitivity analysis varies inputs to see whether the decision is stable. -
3. A study finds that the model's recommended plan differs greatly from what the experienced baker says is sensible. What should you do?
A mismatch is a sign of a possible model error. Treat expert doubt as a validation signal. -
4. Why is the OR process described as a loop?
New findings and changing conditions mean earlier stages are revisited. -
5. Which is an assumption in the bakery model?
Assuming constant hours per batch simplifies reality; the capacity 16 is data, not an assumption.
Summary
- An OR study has six stages: define, collect data, model, solve, validate, implement and monitor.
- Define a decision, an objective, limits and scope before modelling.
- Write down assumptions; validate with expert review, historical tests and sensitivity analysis.
- Implementation and monitoring decide whether the study has any value.
- The process is a loop that you will go around more than once.
Next: A Python Toolkit for OR
Track your progress
Create a free account to tick off lessons and pick up where you left off on any device.
of Operations Research lessons completed