


















Lesson 27 of 49 · Inventory and Scheduling
Uncertain Demand: Newsvendor and Safety Stock
Decide how much to stock when demand is random: the critical ratio, service levels, safety stock and reorder points, with worked numbers and simulations.
Demand is never exactly what the forecast says. A florist cannot know how many bouquets will sell the day before a holiday, a clothing chain cannot know which coat will be popular this winter, and a pharmacy cannot know how many flu shots will be requested. Order too few, and you lose sales and disappoint customers. Order too many, and you are stuck with leftovers sold at a loss.
The newsvendor model (also called the single-period model) is the classic answer for one-shot decisions. A second tool, safety stock, handles items that are reordered again and again. Both rest on one idea: compare the cost of being a unit too low with the cost of being a unit too high.
What you will learn
- The overage and underage costs and how they give the critical ratio.
- How to find the best order quantity for a normal demand distribution.
- How safety stock and the reorder point follow from a service-level target.
- The difference between cycle service level and fill rate.
Key terms
Underage cost (Cu): profit lost for each unit of demand you could not serve, usually price minus cost.
Overage cost (Co): loss for each unit left over, usually cost minus salvage value.
Critical ratio: Cu / (Cu + Co), the probability of NOT stocking out that the best order achieves.
Safety stock: extra inventory held above expected demand to protect against variability.
Service level: the probability of not running out during a cycle.
The newsvendor model
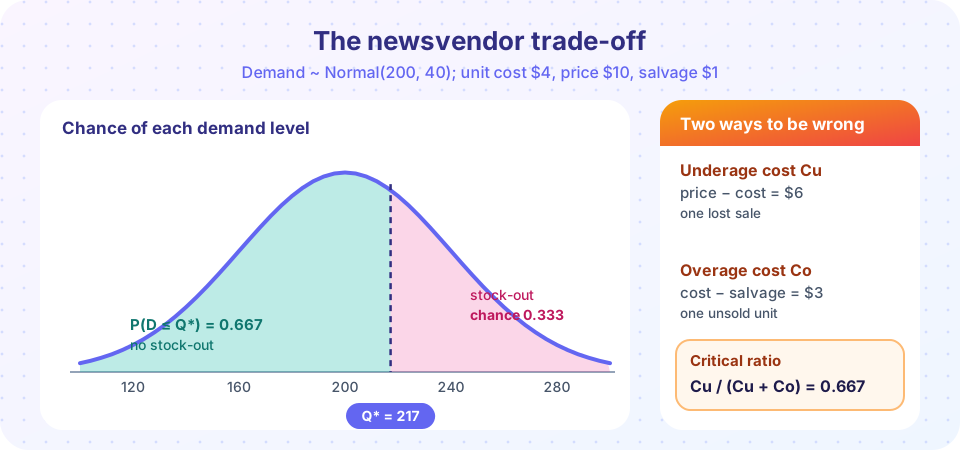
A vendor buys newspapers for $4 each, sells them for $10 and recovers $1 for every unsold paper (recycling). Demand tomorrow is uncertain; suppose it is roughly normal with a mean of 200 and a standard deviation of 40. How many should she buy?
Think about the last unit. Buying one more unit has two possible outcomes:
- With probability
P(D > Q), the unit is needed, and it earnsCu = 10 − 4 = $6. - With probability
P(D ≤ Q), it is not needed, and it losesCo = 4 − 1 = $3.
Adding the unit is worthwhile while the expected gain exceeds the expected loss: Cu × P(D > Q) > Co × P(D ≤ Q). At the best Q, the two are equal. Writing F(Q) = P(D ≤ Q) for the cumulative distribution function and rearranging:
F(Q*) = Cu / (Cu + Co)
Here 6 / 9 = 0.667. So the vendor should buy enough papers that she has a 66.7 percent chance of covering demand. For a normal distribution, Q* = μ + z σ, where z is the standard normal value with cumulative probability 0.667, about 0.43. That gives Q* = 200 + 0.43 × 40 ≈ 217.
Notice what the model says. When Cu > Co (profit margins are high and leftovers cost little) you stock above the average demand. When Co > Cu (thin margins, costly leftovers) you stock below the average. The forecast mean is the right answer only when both costs are equal.
Discrete demand
When demand takes whole-number values, find the smallest Q whose cumulative probability reaches the critical ratio. Suppose a bakery sells a special loaf with demand 10, 11, 12, 13 or 14 and probabilities 0.1, 0.2, 0.3, 0.25 and 0.15 (cumulative 0.1, 0.3, 0.6, 0.85, 1.0). If Cu = $2 and Co = $1, the ratio is 0.667 and the smallest Q with F(Q) ≥ 0.667 is 13.
Try it
First compute the answer and check it by brute force: simulate thousands of days and find which order quantity earns the most on average.
Press Run (or Ctrl + Enter) to see the result here.
Program input · what you'd type while the program runs
Type the answers before you press Run, one per line. Each time the program reads a line (with input()), it gets the next line from this box.
The simulated profits peak near 217, matching the formula.
Safety stock for repeated orders
Items you reorder continuously, such as a hardware store's screws, have no "end of the season". The question becomes: at what stock level should we reorder, given that demand during the lead time is random?
Suppose weekly demand has mean 100 and standard deviation 20, and the lead time is 2 weeks. Demand during the lead time has:
- Mean:
100 × 2 = 200. - Standard deviation:
20 × √2 ≈ 28.3. Variances add for independent weeks, so the deviation grows with the square root of the lead time.
If we want a 95 percent cycle service level (a 95 percent chance that stock lasts until the next delivery arrives), we use z = 1.645 and
Safety stock = z × σ_L ≈ 1.645 × 28.3 ≈ 46.5
Reorder point = mean lead-time demand + safety stock ≈ 200 + 46.5 ≈ 246.5
The reorder point is the average demand during the wait plus a cushion proportional to its variability. Longer lead times and higher variability demand more cushion; higher service levels do too, with sharply increasing cost, as the plot below shows.
Press Run (or Ctrl + Enter) to see the result here.
Program input · what you'd type while the program runs
Type the answers before you press Run, one per line. Each time the program reads a line (with input()), it gets the next line from this box.
Cycle service level versus fill rate
The cycle service level counts cycles with no stock-out; it does not say how bad a stock-out is. The fill rate measures the fraction of demand served from stock. A system could have a 90 percent service level and a 99.5 percent fill rate if the rare stock-outs are tiny. Managers should state which they mean, because the stock required to reach a fill-rate target is usually lower than that for the same cycle service level.
Where else the newsvendor logic appears
The newspaper story is a convenient picture, but the structure appears everywhere that a capacity or quantity must be fixed before demand is known. A restaurant decides how many portions of a daily special to prepare. A clothing chain decides how much of a seasonal coat to buy months before winter. A hospital decides how many units of a short-shelf-life blood product to stock. A cloud provider decides how many servers to reserve. In each case you can write down an underage cost (the margin lost or the harm done when demand is not met) and an overage cost (the loss on leftovers) and apply the same critical ratio.
The ratio also gives a quick sanity check. If the margin is large and leftovers are cheap, as with a popular medicine that can be sold next month, the ratio is close to 1 and you should stock generously. If leftovers are costly, as with fresh sushi, the ratio is low and you should stock below the average demand and accept a few stock-outs. The model turns "be careful" and "be bold" from feelings into numbers.
From one period to many
The newsvendor model assumes a single decision. If leftover stock can be carried over to the next period, the problem becomes a multi-period one, and the best policy is often an order-up-to rule: each period, order enough to bring the stock position up to a target level, computed with a critical ratio much like the one above. Chapter 6 and the projects of chapter 9 show how simulation can test such policies when formulas become hard.
Common misconceptions
"Order the forecast." The mean forecast is the best order only when overage and underage costs are equal. Otherwise the optimum sits above or below the mean.
"A 95 percent service level means 95 percent of customers are served." It means 95 percent of replenishment cycles have no stock-out. Customers served is the fill rate, which is a different number.
"Safety stock grows linearly with lead time." It grows with the square root of lead time when weekly demands are independent. Cutting the lead time from 4 weeks to 1 week halves the safety stock, not quarters it.
Check your understanding
Quick check · 5 questions
of 5 answered You scored / 5 · perfect!
-
1. A seller earns $12 on each sale and loses $8 on each unsold unit. What is the critical ratio?
Cu = 12 and Co = 8, so the ratio is 12 / (12 + 8) = 0.6. -
2. If Cu is much larger than Co, the best order quantity is...
A high critical ratio means that running out is costly, so you stock above the mean to avoid it. -
3. Weekly demand has standard deviation 30 and lead time is 4 weeks. What is the lead-time standard deviation (independent weeks)?
30 × √4 = 60. Variances add, so the standard deviation scales with the square root of the number of weeks. -
4. Which statement about fill rate is true?
Fill rate is the fraction of demand served from stock; the cycle service level counts cycles, not demand. -
5. Which change raises the reorder point?
A higher target needs a larger z and therefore more safety stock.
Summary
- The newsvendor model compares the underage cost
Cuand the overage costCofor one unit. - The best order satisfies
F(Q*) = Cu/(Cu + Co); for normal demandQ* = μ + zσ. - For repeated orders, the reorder point is mean lead-time demand plus
z × σ_L, andσ_Lgrows with the square root of the lead time. - Cycle service level and fill rate are different targets; always say which one you mean.
Track your progress
Create a free account to tick off lessons and pick up where you left off on any device.
of Operations Research lessons completed