


















Lesson 42 of 49 · Heuristics and Practice
From Messy Problem to Decision: The OR Workflow
Follow a complete operations research project: understand the problem, build a model, solve it, run sensitivity analysis, validate and explain results.
Textbook problems arrive neatly packaged: the objective is stated, the constraints are listed and the numbers are given. Real problems arrive as a complaint. "The ovens are always busy, and we still run out of cake." "Drivers say the routes are unfair." "Why is the call center so slow on Mondays?" The skill of an operations researcher lies as much in turning such a complaint into a model, and then a model into a decision someone is willing to act on, as in solving the model.
This lesson walks through the whole workflow on a small example, a bakery that must decide how much bread and how many cakes to bake each day, and then lists the habits that separate projects that work from projects that end up in a drawer.
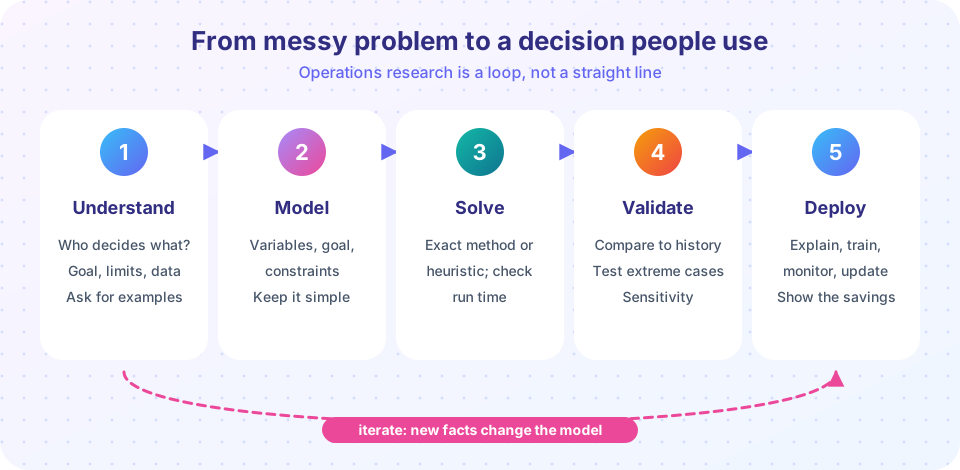
What you will learn
- The five steps of an OR project and what happens in each.
- How to translate a business problem into variables, an objective and constraints.
- How to read shadow prices and sensitivity results to find bottlenecks.
- How to validate a model and present the result to decision-makers.
Key terms
Decision variables: the quantities you control (here, loaves and cakes per day).
Objective: the measure to maximize or minimize (daily profit).
Constraints: limits the decision must respect (oven hours, labor hours, demand).
Shadow price: the change in the optimal objective per unit increase of a constraint's limit.
Validation: checking that the model represents reality well enough for the decision.
Step 1: Understand the problem
Before any mathematics, find out who decides what, with which goal, under which limits. Talk to the people who do the work, not only to the manager. Ask for typical days and for a recent bad day. Write the problem in one sentence: "Choose daily quantities of bread and cake to maximize profit, given oven hours, labor hours and the demand we can sell."
Our bakery's facts (example figures):
| Product | Profit per unit | Oven hours per unit | Labor hours per unit | Daily demand limit |
|---|---|---|---|---|
| Bread | $3 | 0.5 | 0.2 | 60 |
| Cake | $5 | 0.4 | 0.5 | 50 |
The ovens run 40 hours a day and the staff can work 24 labor hours a day.
Step 2: Build the model
Let b and c be the numbers of loaves and cakes. The model is a linear program (see the linear programming track):
maximize 3b + 5c
subject to 0.5b + 0.4c ≤ 40 (oven hours)
0.2b + 0.5c ≤ 24 (labor hours)
b ≤ 60, c ≤ 50, b, c ≥ 0
A good model is as simple as the decision allows. Resist adding every detail you have heard about; each extra feature costs data, explanation and bugs. Start with a model that captures the main trade-off, check it, and add detail only where it changes decisions.
Step 3: Solve
Use the right tool for the structure. Linear programs are solved exactly and quickly by standard solvers, as below. If the model had been a routing or timetabling problem, you would reach for a heuristic from this chapter.
Press Run (or Ctrl + Enter) to see the result here.
Program input · what you'd type while the program runs
Type the answers before you press Run, one per line. Each time the program reads a line (with input()), it gets the next line from this box.
The optimal plan is 60 loaves and 24 cakes for $300 a day. The shadow prices tell the story: an extra labor hour is worth $10, while an extra oven hour is worth nothing, because the ovens are not the bottleneck (they are used for 39.6 of 40 hours). The common complaint "the ovens are always busy" would have led the owner to buy a second oven, a useless investment.
Step 4: Validate and test sensitivity
Before presenting any result, check that it is credible.
- Reproduce the past. Feed in last month's plan: is it feasible in your model, and does the profit match the accounts?
- Check extreme cases. With zero labor hours, does the model bake nothing? With unlimited ovens, does labor become the only limit?
- Ask the experts. Show the plan to the head baker and listen to the objections; they often reveal a missing constraint.
- Run sensitivity analysis. Change one input at a time and see how the plan and profit respond.
Press Run (or Ctrl + Enter) to see the result here.
Program input · what you'd type while the program runs
Type the answers before you press Run, one per line. Each time the program reads a line (with input()), it gets the next line from this box.
The curve is steep at first (each labor hour adds about $10, up to roughly 24.5 hours), and then becomes less steep as the bread demand limit and the ovens begin to bind. At 36 hours the best plan is 40 loaves and 50 cakes, which uses all 40 oven hours, so the ovens now limit profit. This is the range over which a shadow price is valid, and it is the number to quote when the owner asks, "Is it worth paying overtime?" The first extra labor hour beyond today's 24 is worth about $10, but later hours are worth less, and with enough labor the ovens become the bottleneck instead.
Step 5: Deploy and communicate
A model that is not used has saved nobody any money. Good practice:
- Lead with the decision and its value, not with the mathematics: "Bake 60 loaves and 24 cakes, and consider more labor, not more ovens. Expected gain: about $10 a day compared with the old plan of 50 loaves and 28 cakes."
- Show scenarios instead of single numbers, and state the assumptions behind them.
- Make it usable: a spreadsheet, a dashboard or an automatic job, with clear inputs.
- Plan for maintenance. Prices, demand and capacities change; the model needs an owner who updates it.
- Consider fairness and people. A schedule that is optimal on paper but unfair to workers will be resisted or gamed. Include such concerns in the objective or constraints when they matter.
Common modelling pitfalls
| Pitfall | Example | Fix |
|---|---|---|
| Solving the wrong problem | Minimizing cost when the owner cares about service | Confirm the objective in writing |
| Missing constraint | Plan ignores that cakes need the same oven as bread in the morning | Ask the people who do the work |
| Bad data | Average labor time that hides big differences | Measure, or test sensitivity to the data |
| Over-precision | Reporting $300.00 when inputs are rough | Quote ranges |
| No ownership | Nobody updates the model | Name an owner at the start |
Common misconceptions
"The solver's answer is the answer." It is the best answer to the model. If the model omits something important, the answer can be wrong in practice.
"A more detailed model is a better model." Detail costs data and clarity; use only what changes the decision.
"Once solved, the project is done." Deployment, validation and maintenance are where most value is won or lost.
Check your understanding
Quick check · 5 questions
of 5 answered You scored / 5 · perfect!
-
1. In the bakery model, what does a shadow price of $10 for labor hours mean?
A shadow price is the improvement in the optimal objective per unit increase of the constraint's limit. -
2. The oven constraint has a shadow price of 0 because...
The optimal plan uses 39.6 of 40 oven hours, so extra oven time would not raise profit. -
3. Which is the FIRST step in an OR project?
Without a clear problem statement, a model may solve the wrong problem. -
4. Why test a model by reproducing last month's plan?
If the model cannot reproduce known history, its predictions are not trustworthy. -
5. What should a presentation to managers lead with?
Decision-makers act on decisions and values, so give those first and the technical details on request.
Summary
- An OR project has five steps: understand, model, solve, validate and deploy, with iteration between them.
- Shadow prices and sensitivity analysis reveal the real bottleneck (labor, not ovens, in our example).
- Validate by reproducing history, testing extremes and consulting experts.
- Communicate the decision and its value first, and plan for maintenance and fairness.
Next: Chapter 8 review
Track your progress
Create a free account to tick off lessons and pick up where you left off on any device.
of Operations Research lessons completed