


















Lesson 38 of 46 · Model Validation and Communication
Sensitivity and uncertainty
Find which inputs drive a model's answer with tornado charts and rank correlations, and turn uncertain parameters into honest output ranges with Monte Carlo.
Every parameter in a model comes from somewhere: a measurement, an estimate from the literature, a guess. None of them is exact. Two questions follow. First, which inputs matter? If the answer hardly changes when an input does, you can stop worrying about it. Second, how uncertain is the output given what you know about the inputs? This lesson gives you the standard tools for both: one-at-a-time sensitivity (the tornado chart) and Monte Carlo propagation of uncertainty.
What you will learn
- How to run a one-at-a-time sensitivity analysis and draw a tornado chart.
- What elasticity means and how to compute it.
- How to propagate input uncertainty to an output range by Monte Carlo.
- How to rank inputs by their contribution to the uncertainty.
Key terms
Local sensitivity: how the output changes for a small change in one input around a base value.
Elasticity: the percentage change in the output per percentage change in an input.
Uncertainty propagation: turning the uncertainty of inputs into the uncertainty of an output.
Prediction interval: a range that contains the output with a stated probability, such as 90 percent.
One at a time: the tornado chart
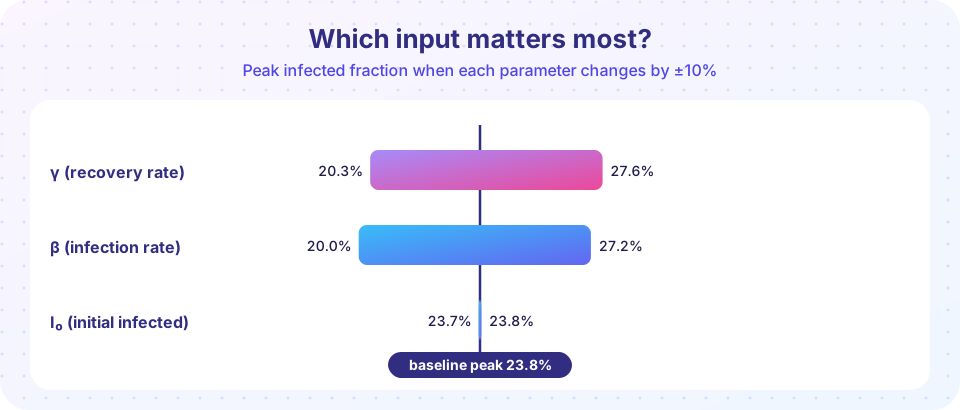
Take the SIR epidemic from Chapter 5 and ask about the peak fraction infected. The base case is β = 0.5, γ = 0.2 and I₀ = 0.01, which gives a peak of 23.7 percent. Now change each parameter by ±10 percent, keeping the others fixed, and record the output. The results from the simulation:
| Parameter | −10% | +10% |
|---|---|---|
| β (infection rate) | 20.0% | 27.2% |
| γ (recovery rate) | 27.6% | 20.3% |
| I₀ (initial infected) | 23.7% | 23.8% |
A tornado chart draws these ranges as horizontal bars sorted by length, with the longest at the top. The picture makes the verdict clear: the peak is sensitive to β and γ, and almost insensitive to I₀. Note the opposite directions: raising β raises the peak, raising γ lowers it. Because the peak depends on the ratio R₀ = β/γ, a 10 percent rise in β and a 10 percent fall in γ have nearly the same effect.
The elasticity summarizes this as one number. If a 10 percent rise in β raises the peak by 14.6 percent (relative to 23.7), the elasticity is about 1.5. Values above 1 mean the output is amplified relative to the input, which is dangerous when the input is uncertain.
Press Run (or Ctrl + Enter) to see the result here.
Program input · what you'd type while the program runs
Type the answers before you press Run, one per line. Each time the program reads a line (with input()), it gets the next line from this box.
Common misconceptions
"The input with the biggest effect is the most important to measure." The effect per percent matters, but so does how uncertain the input is. A moderately sensitive parameter known to 1 percent matters less than a slightly sensitive one known to 50 percent.
"One-at-a-time analysis finds all interactions." It misses them. If two inputs act together (their effect is not the sum of the separate effects), vary them simultaneously, for example with Monte Carlo.
"Uncertainty analysis makes the model look bad." It makes the claims honest. A forecast with a range is more useful than one with false precision.
Propagating uncertainty with Monte Carlo
Suppose our knowledge of the infection rate is β = 0.50 ± 0.05 and of the recovery rate γ = 0.20 ± 0.02 (each a standard deviation, normal distribution). Instead of two extreme cases, draw many random pairs, compute the output for each, and look at the distribution of results. That is uncertainty propagation.
For this model there is an exact formula for the peak, so we can evaluate 100,000 draws in a blink:
I_max = I₀ + S₀ − (1/R₀)·(1 + ln(R₀·S₀)), with R₀ = β/γ and S₀ = 1 − I₀.
The output range is wider than a naive "±10 percent" would suggest, and it is skewed: the peak responds more strongly to larger R₀. We can also rank which input contributes most to the spread of the output, by computing the rank correlation (Spearman) between each input sample and the output. The one with the larger absolute correlation drives more of the uncertainty.
Press Run (or Ctrl + Enter) to see the result here.
Program input · what you'd type while the program runs
Type the answers before you press Run, one per line. Each time the program reads a line (with input()), it gets the next line from this box.
Local and global views
The tornado chart is a local analysis around one base case. It is cheap and easy to explain, but it only tells you what happens near that point. A global analysis samples the whole range of plausible inputs, as in the Monte Carlo above, and can reveal interactions and threshold effects. A practical workflow is to begin with a tornado chart to find the few inputs that matter, then spend your effort on better data for those, and use Monte Carlo to give the final uncertainty range.
Finally, remember the third source of uncertainty, which no sampling of parameters can capture: structural uncertainty. The model itself may leave out something important, such as people changing their behaviour during an epidemic. Say so in your report.
Check your understanding
Quick check · 5 questions
of 5 answered You scored / 5 · perfect!
-
1. In a tornado chart, what does a long bar mean?
Bar length is the output range produced by varying that input over its range. -
2. In the SIR peak example, which input hardly affects the peak?
Changing I0 by 10 percent moves the peak by less than 0.1 percentage points. -
3. An elasticity of 1.5 means:
Elasticity is the relative output change divided by the relative input change. -
4. Why is one-at-a-time analysis not enough?
When inputs act together, varying them separately misses the combined effect. -
5. What is structural uncertainty?
It concerns the form of the model, which parameter sampling cannot capture.
Summary
- Local sensitivity (tornado chart) ranks inputs by their effect on the output.
- Elasticity compares percentage changes; values above 1 amplify input errors.
- Monte Carlo propagation turns input ranges into an output range with percentiles.
- Rank correlation identifies which inputs drive the output uncertainty; remember structural uncertainty too.
Next: Communicating models
Track your progress
Create a free account to tick off lessons and pick up where you left off on any device.
of Mathematical Modelling lessons completed