


















Lesson 36 of 46 · Model Validation and Communication
Chapter 8 overview: model validation and communication
Learn why a working model is not yet a trusted model: fit parameters, test on new data, study sensitivity and explain the results honestly to others.
Building a model that runs is the easy part. The hard questions come next. Does it match reality? Which of its numbers does the answer depend on? And can you explain it to a person who has to decide something, without hiding what you do not know? This chapter is about the second half of modelling: validation (is the model good enough for its purpose?) and communication (can others understand and trust what it says?).
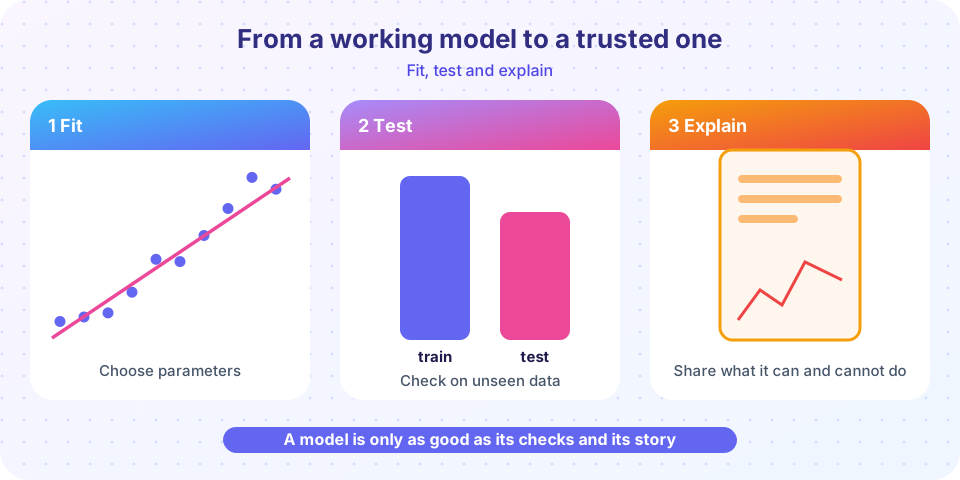
What you will learn
- The difference between fitting a model and validating it.
- Why a model can fit old data beautifully and still predict badly.
- How sensitivity analysis shows which inputs matter.
- What belongs on a one-page report, and how to show uncertainty honestly.
Key terms
Calibration (fitting): choosing parameter values so the model matches observed data.
Validation: testing the calibrated model against data it was not fitted to.
Sensitivity analysis: studying how the output changes when inputs change.
Overfitting: fitting noise so closely that the model fails on new data.
A famous warning
The statistician George Box is remembered for the saying "All models are wrong, but some are useful." The point is not to give up. It is to ask, for every model, the useful question: useful for what? A map that is a perfect copy of a city, at a scale of 1:1, would be useless. A subway diagram that distorts distances is useful because it keeps what travellers need. In the same way, a model of an epidemic can be wrong about the exact number of cases and still be useful for deciding when to build extra hospital capacity.
Validation therefore always starts with the purpose and the decision the model supports. "Good enough" means: if the real answer and the model differ by as much as they plausibly might, would we still make the same decision?
Fit
Test
Probe
Explain
What each lesson covers
- Fitting models by least squares: residuals, the least-squares line, nonlinear fits and the danger of overfitting.
- Sensitivity and uncertainty: one-at-a-time changes, tornado charts and Monte Carlo propagation.
- Communicating models: the one-page report, honest charts and plain-language uncertainty.
- Chapter review: poster, recap and ten questions.
Try it
The next experiment shows why validation matters. A straight line and a ninth-degree polynomial are both fitted to ten noisy points. The wiggly curve goes through every point, yet it is the worse model.
Press Run (or Ctrl + Enter) to see the result here.
Program input · what you'd type while the program runs
Type the answers before you press Run, one per line. Each time the program reads a line (with input()), it gets the next line from this box.
Check your understanding
Quick check · 4 questions
of 4 answered You scored / 4 · perfect!
-
1. What is the difference between calibration and validation?
Calibration fits the model to some data; validation checks it against data not used in fitting. -
2. What does overfitting mean?
An overfit model matches the training data very closely but fails to generalize. -
3. Why should validation start with the decision the model supports?
A model is useful if its plausible errors would not change the decision. -
4. Which is the best use of 'all models are wrong, but some are useful'?
The remark is a prompt to define purpose and limits, not to abandon models.
Summary
- Fit with some data, validate with other data.
- A model can fit old data perfectly and still predict badly (overfitting).
- Sensitivity analysis shows which inputs drive the answer.
- Communicate the question, assumptions, results, uncertainty and limits.
Track your progress
Create a free account to tick off lessons and pick up where you left off on any device.
of Mathematical Modelling lessons completed