


















Lesson 39 of 46 · Model Validation and Communication
Communicating models honestly
Write a clear one-page model report, draw honest charts, show uncertainty with fan charts and state assumptions and limits in plain language.
A model nobody understands changes nobody's mind. The person who must choose how many beds to prepare, how much stock to order or whether a bridge is safe usually is not a modeller. They need to know what the model says, how sure it is, what it assumed, and where it should not be trusted. This lesson shows how to turn a model into a short document and a few clear charts that serve such a reader well.
What you will learn
- The five parts of a good one-page model report.
- Rules for honest, readable charts.
- How to show uncertainty with ranges and fan charts, and how many digits to report.
- How to word assumptions and limits so that a non-expert understands them.
Key terms
Assumption: something the model takes as true without proving it.
Fan chart: a forecast chart where a central line is surrounded by bands showing growing uncertainty.
Significant figures: the digits of a number that carry real information.
Model card: a short structured summary of what a model is for, how it was built and where it fails.
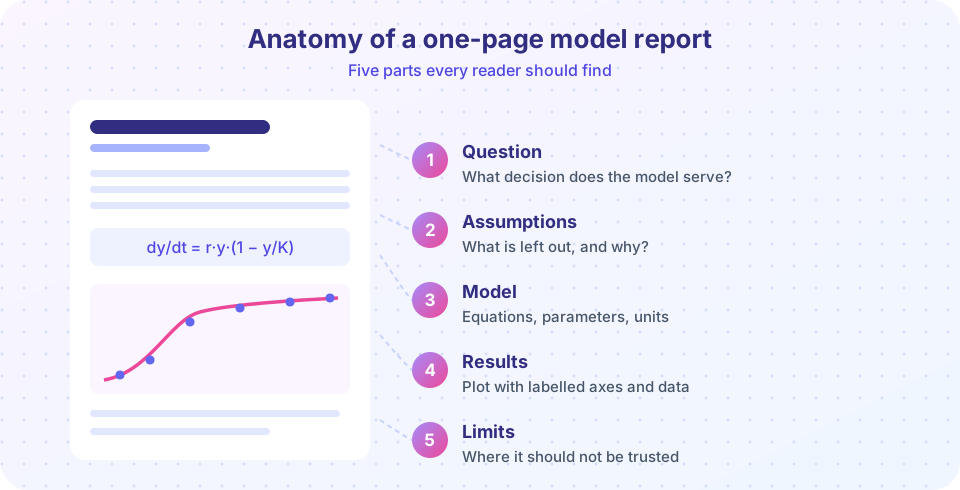
The five-part report
- The question and decision. One sentence: "How many hospital beds will be needed at the peak of an outbreak?" The reader should know at once what the model is for.
- Assumptions. A short list, in plain words: "Everyone mixes equally. People who recover are immune. The infection rate stays constant." Each assumption is a place where the world might differ.
- The model. The equations, with every symbol defined and its unit, plus where each parameter value came from.
- Results. One or two charts and the key numbers, with ranges. Say what the result means for the decision.
- Limits and next steps. Where the model should not be used, what data would improve it, and what you checked (validation, sensitivity).
Lead with the answer. Busy readers should get the headline from the first lines and be able to stop there, while details sit further down for those who want them.
Honest charts
- Label both axes with units. "Infected (% of population)" and "Day since first case", not "y" and "x".
- Start bar charts at zero. A bar's length stands for a quantity. Cutting the axis can turn a 2 percent difference into a "giant" one. (Lines may use any range if the axis is clearly marked.)
- Show the data. If you compare a model with measurements, plot the measured points, not just the fitted curve.
- Show uncertainty. A band or error bars, not only a central line.
- One message per chart. A title that states the finding ("Peak occurs around day 25") helps more than a title that names the variables.
- Colour for meaning. Highlight the key series; keep others muted; remember that readers with colour-vision differences need other cues such as labels.
Uncertainty without false precision
A model that gives "peak infections: 23.7491 percent" invites the question "to how many digits do you trust that?". Round to the precision the inputs justify, often two significant figures: "about 24 percent". Express uncertainty as an interval with a stated probability: "between 18 and 31 percent (90 percent interval)". Avoid jargon such as "p-value" or "standard deviation" unless your reader uses it.
A fan chart is the standard way to show how forecast uncertainty grows with time. Each simulated scenario is a thin line; the median is drawn bold and bands show the 5th to 95th percentile. The demo below builds one from the SIR model with uncertain β and γ.
Press Run (or Ctrl + Enter) to see the result here.
Program input · what you'd type while the program runs
Type the answers before you press Run, one per line. Each time the program reads a line (with input()), it gets the next line from this box.
Writing assumptions and limits in plain words
Compare two statements of the same limitation:
- "The model assumes homogeneous mixing and time-invariant transmission."
- "The model treats everyone as meeting everyone else equally, and assumes people do not change their behaviour as the outbreak grows. In reality both are false, so the real peak could be lower and later than shown."
The second tells the reader what is wrong and which way the error probably goes. Always give the direction if you know it. Also say what you validated and what you did not: "the model was checked against the first three weeks of data; the later part of the curve is a prediction."
Press Run (or Ctrl + Enter) to see the result here.
Program input · what you'd type while the program runs
Type the answers before you press Run, one per line. Each time the program reads a line (with input()), it gets the next line from this box.
Common misconceptions
"More detail makes a report more convincing." A cluttered report hides the message. Put the essentials first and the details in an appendix.
"Hiding the uncertainty protects trust." When the real outcome falls outside an overconfident forecast, trust collapses. A stated range that contains the outcome builds it.
"A good chart needs 3D effects and bright colours." Plain, labelled charts communicate better. Decoration can distort size and shape.
See how a truncated axis misleads
Two models score 96.0 and 97.5 percent on a test. Is Model B "far better"? Toggle the axis start and judge for yourself.
Check your understanding
Quick check · 5 questions
of 5 answered You scored / 5 · perfect!
-
1. Which of these belongs at the very start of a one-page model report?
Readers should see what the model is for and what it says first; details follow. -
2. Why should a bar chart's axis start at zero?
A truncated bar axis makes small differences look large. -
3. A model gives a peak of 23.7491 percent from inputs known to two digits. What is the best way to report it?
Report no more precision than the inputs justify, and include an uncertainty range. -
4. What does a fan chart show?
The bands widen as scenarios spread apart. -
5. Which limitation statement is most useful for a reader?
It says what is assumed in plain words and which way the error probably goes.
Summary
- A one-page report has five parts: question, assumptions, model, results, limits.
- Honest charts have labelled axes, zero-based bars, visible data and uncertainty.
- Round to sensible precision and give ranges with a stated probability.
- Say in plain words what the model leaves out and which way the error likely goes.
Next: Chapter 8 review
Track your progress
Create a free account to tick off lessons and pick up where you left off on any device.
of Mathematical Modelling lessons completed