


















Lesson 40 of 46 · Model Validation and Communication
Chapter 8 review: model validation and communication
Review least-squares fitting, residuals, overfitting, sensitivity analysis and clear communication with a summary poster, a checklist and a ten-question quiz.
A model you can trust has passed through four gates: it was fitted sensibly, tested on data it had not seen, probed for sensitivity and uncertainty, and explained honestly. This page collects the chapter on one poster, offers a validation checklist, runs a small experiment on cross-validation, and ends with a ten-question quiz.
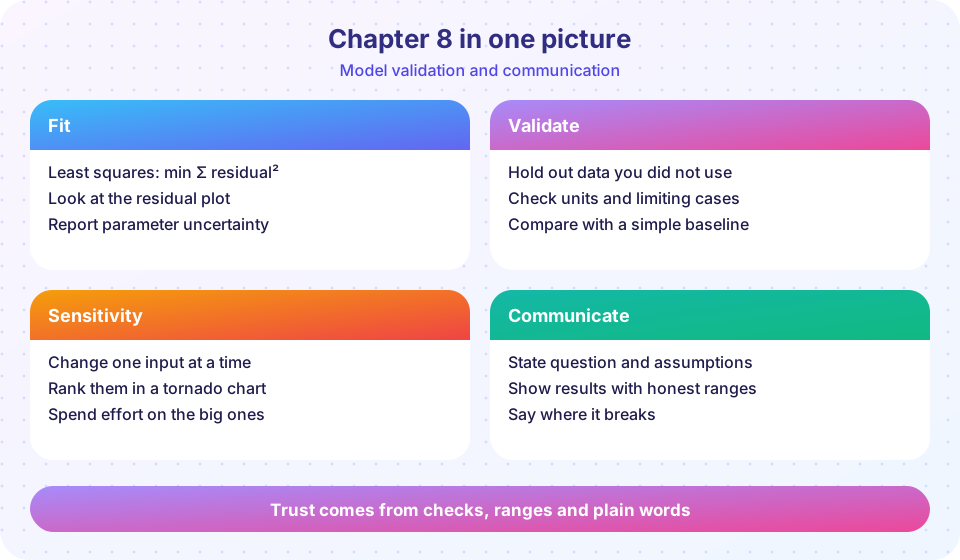
Recap table
| Step | Question | Tool |
|---|---|---|
| Fit | Which parameter values match the data? | least squares, curve_fit |
| Diagnose | Do the residuals look random? | residual plot, R² |
| Validate | Does it predict data it has not seen? | train/test split, cross-validation |
| Probe | Which inputs matter? | tornado chart, elasticity |
| Propagate | How uncertain is the output? | Monte Carlo, percentile interval |
| Communicate | Can a decision-maker use it? | one-page report, honest charts |
A validation checklist
- Purpose. Is the decision the model supports written down?
- Units and limits. Do units balance, and does the model behave correctly in extreme cases (zero, very large)?
- Calibration. Are parameter values justified and their uncertainty stated?
- Out-of-sample test. Was the model tested on data that it was not fitted to?
- Sensitivity. Which three inputs matter most?
- Alternatives. Does a simpler model do about as well? If so, prefer it.
- Report. Are assumptions, limits and ranges stated in plain words?
Try it
Cross-validation repeats the train/test idea several times. Split the data into k folds, fit on k − 1 folds, test on the remaining one, and average the test errors. It uses all data for both fitting and testing without ever testing on data that was fitted. The experiment below uses it to choose the degree of a polynomial.
Press Run (or Ctrl + Enter) to see the result here.
Program input · what you'd type while the program runs
Type the answers before you press Run, one per line. Each time the program reads a line (with input()), it gets the next line from this box.
The second tool is the habit of reporting honest precision. This tiny helper rounds a result and its interval consistently.
Press Run (or Ctrl + Enter) to see the result here.
Program input · what you'd type while the program runs
Type the answers before you press Run, one per line. Each time the program reads a line (with input()), it gets the next line from this box.
Check your understanding
Quick check · 10 questions
of 10 answered You scored / 10 · perfect!
-
1. Why is a model's error on its own training data a poor measure of its quality?
Flexible models can fit training data, noise included, almost perfectly. -
2. In k-fold cross-validation each data point is used for testing:
Each fold takes a turn as the test set, so every point is tested once. -
3. A residual plot shows a clear U-shaped curve. What does this suggest?
Patterned residuals mean the model misses a systematic feature. -
4. In a tornado chart the longest bar belongs to the input that:
Bars show the output range for each input. -
5. Which statement about R-squared is correct?
A high R-squared can coexist with a wrong model shape. -
6. A Monte Carlo forecast gives a 90 percent interval of 18 to 31 percent. How should it be reported?
Honest communication includes the range and what it covers. -
7. Which axis rule is right for a bar chart?
Bar length encodes the quantity, so a zero-based axis avoids exaggeration. -
8. What does elasticity measure?
It is the ratio of relative changes. -
9. Which is NOT a part of the five-part one-page report?
The five parts are question, assumptions, model, results and limits. -
10. Two models predict equally well on test data, one simple and one complicated. Which should you usually prefer?
A simpler model is easier to explain, check and maintain when accuracy is equal.
Summary
- Trust = fit, test on new data, probe sensitivity, communicate limits.
- Use residual plots and cross-validation to catch wrong shapes and overfitting.
- Tornado charts and Monte Carlo ranges show what matters and how sure you are.
- Report plain-language results with sensible precision and ranges.
Track your progress
Create a free account to tick off lessons and pick up where you left off on any device.
of Mathematical Modelling lessons completed