


















Lesson 35 of 49 · Structural Bioinformatics
Protein Structure and PDB Files
Learn to read PDB and mmCIF files, compute distances and phi/psi dihedral angles from coordinates, understand helices and sheets, and judge structure quality.
When you download a structure from the Protein Data Bank, you get a plain text file. Behind the 3D picture on the website sits nothing more mysterious than a long table: one line per atom, with its name, the residue it belongs to, and three numbers for its position in space. Everything else (the ribbons, the surfaces, the distance measurements) is computed from that table.
This lesson teaches you to read that table, to extract geometry from it with a few lines of code, and to recognize what the numbers in it mean about how trustworthy the model is. You will compute the distance between neighboring atoms, calculate the backbone dihedral angles that define a protein's local shape, and draw the famous Ramachandran plot.
What you will learn
- How a PDB file is organized and how the older format differs from mmCIF.
- How to parse ATOM records by column position.
- How to compute distances and dihedral angles, and what phi and psi mean.
- How to read a Ramachandran plot and a contact map.
- What resolution, occupancy and B-factor say about a model.
Key terms
ATOM / HETATM: coordinate records for standard residues and for other molecules (ligands, ions, water), respectively.
Backbone: the repeating N, C-alpha, C chain of atoms that runs through every protein.
Dihedral angle: the twist around a bond, defined by four consecutive atoms; phi and psi are the two backbone dihedrals.
B-factor: a number per atom describing how much its position is smeared out, from thermal motion and disorder.
Occupancy: the fraction of molecules in the crystal in which the atom sits at the listed position.
Anatomy of a PDB file
A classic PDB file begins with a header describing the structure and its origin, followed by records in a fixed order:
| Record | Content |
|---|---|
HEADER, TITLE, COMPND, SOURCE |
name, molecule and organism |
REMARK 2, REMARK 3 |
resolution and refinement statistics |
SEQRES |
the full sequence of each chain |
HELIX, SHEET |
secondary-structure assignment |
ATOM |
one line per atom of standard amino acids or nucleotides |
HETATM |
ligands, ions, modified residues and water (HOH) |
TER |
end of a chain |
CONECT |
bonds for non-standard groups |
END |
end of file |
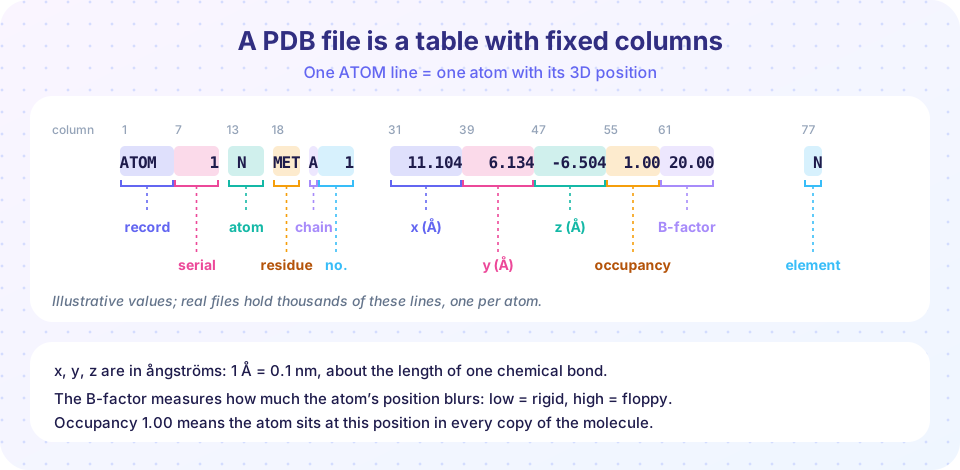
The coordinate lines follow a fixed-column layout, shown in the figure above: columns 1 to 6 hold the record name, 7 to 11 the atom serial number, 13 to 16 the atom name, 18 to 20 the residue name, 22 the chain identifier, 23 to 26 the residue number, 31 to 54 the x, y and z coordinates in ångströms (eight characters each, three decimals), 55 to 60 occupancy, 61 to 66 the B-factor and 77 to 78 the element. Because the layout is by column, not by spaces, you parse with string slices, not by splitting on whitespace.
The fixed layout also explains the format's limits: it cannot hold more than 99,999 atoms or more than 62 chains with single-character identifiers, so very large structures (ribosomes, viruses) could not be written. The modern archive format is PDBx/mmCIF, a flexible table-based text format in which each column has a name such as _atom_site.Cartn_x, with no size limits. The wwPDB treats mmCIF as the primary format and large structures exist only in it. Libraries such as Biopython (Bio.PDB), Gemmi and MDAnalysis read both, and viewers such as PyMOL, UCSF ChimeraX and the Mol* viewer on the PDB website display them.
Geometry from coordinates
Distances
The distance between two atoms is the Euclidean distance of their coordinates: d = sqrt((x1-x2)^2 + (y1-y2)^2 + (z1-z2)^2). Reference values worth knowing:
| Interaction | Typical distance |
|---|---|
| Covalent bond (C-C, C-N) | 1.3 to 1.5 Å |
| Peptide C-N bond (partial double bond) | about 1.33 Å |
| Hydrogen bond (donor to acceptor) | 2.6 to 3.2 Å |
| Neighboring C-alpha atoms in a chain | about 3.8 Å |
| Van der Waals contact | 3.4 to 4.0 Å |
The constant 3.8 Å between consecutive C-alpha atoms (trans peptides) is a handy sanity check: if you find a gap of 6 Å between consecutive residues, the chain is broken or a segment is missing.
Dihedral angles and the Ramachandran plot
The backbone of each residue has three bonds that matter. The peptide bond (C to N) is nearly rigid and flat, with its angle omega almost always close to 180° (a trans peptide). Rotation is free around the other two bonds: phi is the rotation about the N to C-alpha bond, defined by the atoms C(i-1), N(i), C-alpha(i), C(i), and psi is the rotation about the C-alpha to C bond, defined by N(i), C-alpha(i), C(i), N(i+1). Every residue is described locally by its pair (phi, psi), and therefore the whole backbone by a list of pairs.
Most of the geometrically possible pairs are impossible because of steric clashes between atoms. In 1963 G. N. Ramachandran and colleagues worked out which regions are allowed. Plotting phi against psi for every residue of a protein gives the Ramachandran plot, with a few dense regions:
- Alpha-helix: phi near -60°, psi near -45°.
- Beta-strand: phi near -120°, psi near +130°.
- Left-handed helix: phi near +60°, psi near +45°, uncommon except for glycine.
Glycine, with no side chain, is much freer; proline, whose ring locks phi near -65°, is more restricted. Residues in disallowed regions are Ramachandran outliers, and structure validation tools such as MolProbity count them as a quality signal.
Secondary structure from geometry
In an alpha helix each residue turns by about 100° around the axis and rises 1.5 Å along it, giving 3.6 residues per turn and a pitch of 5.4 Å. The backbone C=O of residue i hydrogen-bonds with the N-H of residue i+4. In a beta sheet, extended strands lie side by side and are held by hydrogen bonds between neighbors, running parallel or antiparallel. The DSSP program assigns one-letter codes from these hydrogen-bond patterns: H helix, G 3-10 helix, I pi helix, E extended strand, B isolated bridge, T turn, S bend, and - for coil.
Contact maps
A contact map is a square matrix whose entry (i, j) is 1 when residues i and j are close in space (a common definition: C-beta atoms within 8 Å). It reduces a 3D structure to a 2D picture independent of orientation. Helices appear as a thick band along the diagonal, antiparallel beta hairpins as lines perpendicular to the diagonal, and contacts between distant parts of the chain as off-diagonal blobs. Contact maps are central to structure prediction, as the next lessons show.
Reading quality information
A structure is a model built to fit experimental data, not a photograph. Several numbers tell you how well it fits:
- Resolution (REMARK 2 or the website summary): smaller is finer. Side-chain positions below about 2.5 Å are reliable, and at 3.5 Å and worse they are partly guesses.
- R-free: a cross-validated measure of how well the model predicts held-out diffraction data; values below about 0.25 are typical for good medium-resolution models.
- B-factors: high values flag floppy surface loops and termini. They are named "temperature factors" for historical reasons, but they also reflect static disorder.
- Occupancy below 1.0 and alternate locations (altLoc) mark atoms with more than one conformation.
- Missing residues: parts of the chain that could not be seen at all, usually disordered loops, appear in
SEQRESbut have noATOMlines.
Common misconceptions
"A PDB structure shows the protein's shape exactly." It shows a model consistent with the data, averaged over many molecules and often in a crystal or frozen state. Flexible regions may be poorly defined or absent.
"One structure is the structure." Proteins move. The same protein can have many entries, with and without ligands, and the differences matter for function.
"A high B-factor means the atom is hot." It means its position is uncertain or mobile; it is a measure of disorder, not of temperature in the sample.
Try it
First you write a PDB line, then parse it back with column slices and compute distances. Second, compute dihedral angles and draw a Ramachandran plot for simulated residues. Third, build and plot the contact map of an ideal helix.
Press Run (or Ctrl + Enter) to see the result here.
Program input · what you'd type while the program runs
Type the answers before you press Run, one per line. Each time the program reads a line (with input()), it gets the next line from this box.
Press Run (or Ctrl + Enter) to see the result here.
Program input · what you'd type while the program runs
Type the answers before you press Run, one per line. Each time the program reads a line (with input()), it gets the next line from this box.
Press Run (or Ctrl + Enter) to see the result here.
Program input · what you'd type while the program runs
Type the answers before you press Run, one per line. Each time the program reads a line (with input()), it gets the next line from this box.
Check your understanding
Quick check · 5 questions
of 5 answered You scored / 5 · perfect!
-
1. Why must you parse classic PDB ATOM lines by character columns rather than by splitting on spaces?
Fields are fixed-width; a value like -123.456 can fill its eight characters and merge with its neighbor. -
2. What distance separates consecutive C-alpha atoms in a typical trans peptide chain?
About 3.8 Å, a useful check for chain breaks. -
3. On a Ramachandran plot, residues in a typical alpha helix cluster near:
The right-handed alpha helix region is around phi -60 and psi -45. -
4. In an alpha helix, the C=O of residue i hydrogen-bonds with the N-H of residue:
The i to i+4 pattern closes each helical turn of 3.6 residues. -
5. What does a high B-factor on an atom suggest?
B-factors measure positional uncertainty from motion and disorder.
Summary
- A PDB file is a table of atoms with fixed columns; mmCIF is the modern, unlimited format.
- Coordinates are in ångströms; consecutive C-alpha atoms are about 3.8 Å apart.
- Phi and psi describe the local backbone twist; the Ramachandran plot shows allowed regions (alpha, beta, left-handed).
- Helices have 3.6 residues per turn and i to i+4 hydrogen bonds; contact maps summarize 3D contacts in 2D.
- Judge a model by resolution, R-free, B-factors, occupancy and missing residues; a structure is a model, not a photograph.
Next: Superposition and RMSD
Track your progress
Create a free account to tick off lessons and pick up where you left off on any device.
of Bioinformatics lessons completed