


















Lesson 25 of 49 · Genomics Pipelines
FASTQ and Read Quality
Learn how a FASTQ record is built, how Phred scores encode base-call errors, how to read a quality report, and how to trim adapters and low-quality tails.
Every genomics pipeline begins with the same kind of file: the FASTQ. A sequencing machine does not just report "A, C, G, T". For every base it also says how sure it is. That second stream of information, the quality score, is what lets later programs tell a real variant from an instrument error.
In this lesson you will take a FASTQ record apart, decode the quality string by hand, learn what the Phred scale really means, and see how quality control and trimming clean the data before mapping. These are small, concrete skills, but a surprising share of "mysterious" results in genomics trace back to reads that were never inspected.
What you will learn
- How the four lines of a FASTQ record are arranged and how paired-end data is stored.
- How a Phred quality score relates to the probability of a wrong base call, and how to convert both ways.
- How to decode a quality string with the ASCII offset 33.
- What a quality-control report (FastQC, MultiQC) shows and which patterns are worrying.
- Why and how reads are trimmed, and what trimming cannot fix.
Key terms
FASTQ: a text format with four lines per read: name, bases, a separator and quality characters.
Phred score (Q): a logarithmic quality value, Q = -10 * log10(P), where P is the estimated probability that a base is wrong.
Adapter: a known synthetic sequence attached to DNA fragments during library preparation.
Paired-end reads: two reads taken from the two ends of the same fragment.
Trimming: removing adapter sequence or low-quality bases from the ends of reads.
The four lines of a FASTQ record
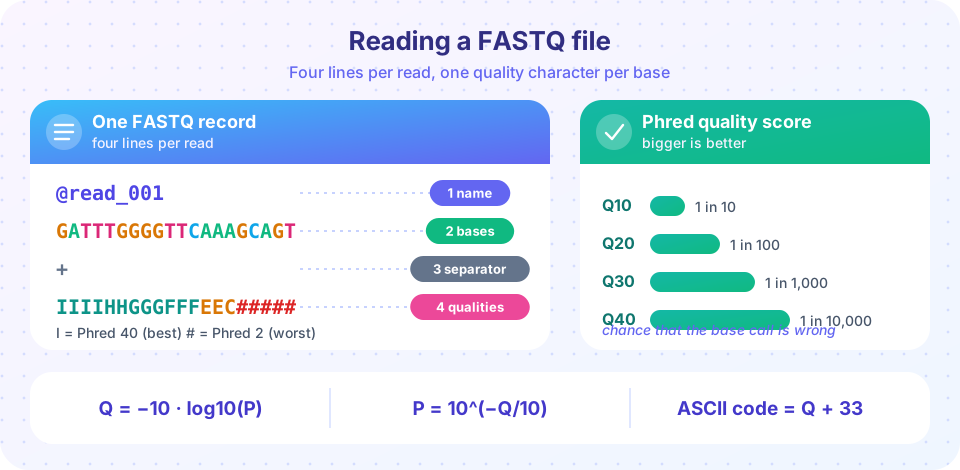
A FASTQ file is plain text, usually compressed as .fastq.gz. Each read occupies exactly four lines:
@read_001
GATTTGGGGTTCAAAGCAGT
+
IIIIHHGGGFFFEEC#####
- The name line begins with
@and holds a unique identifier. On Illumina machines it packs in the instrument, run, flow cell lane, tile and x/y coordinates of the cluster on the flow cell, and often a second field such as1:N:0:ATCACGgiving the read number, a filter flag and the sample barcode. - The sequence line holds the called bases: A, C, G, T, and
Nwhere the machine could not decide. - The separator line is a
+, optionally followed by a repeat of the name (rare today). - The quality line has exactly one character per base. It must be the same length as the sequence line.
Because the quality alphabet includes @ and +, a parser can never recognise a record by looking for those characters at the start of a line. A line starting with @ might be a quality string. Real parsers simply read the file in blocks of four lines. That is also why you must never reorder or filter FASTQ lines with a generic text tool such as sort or a line-based grep.
Paired-end data
Most short-read runs sequence a fragment from both ends. The result is two files, conventionally sample_R1.fastq.gz and sample_R2.fastq.gz. The nth record in the first file and the nth record in the second file are mates of the same fragment. Programs rely on this strict order, so trimming tools must drop or keep reads in both files together. When you know the typical fragment length (the insert size), a mapper can use the pair as a ruler: two mates that land 400 bases apart on the same chromosome facing each other are a convincing placement.
The Phred scale
The quality character stores a number between 0 and about 41. The number, called Q, is defined from the machine's estimated probability P that the base call is wrong:
Q = -10 * log10(P) and equivalently P = 10^(-Q/10)
| Q | P (probability of error) | One error in | Accuracy |
|---|---|---|---|
| 10 | 0.1 | 10 | 90% |
| 20 | 0.01 | 100 | 99% |
| 30 | 0.001 | 1,000 | 99.9% |
| 40 | 0.0001 | 10,000 | 99.99% |
The scale is logarithmic for the same reason the decibel scale is: the interesting differences between 99% and 99.99% accuracy would otherwise be squashed into the last decimal places. Every 10 points of Q is a tenfold drop in the error rate. Q30 is the number you will see most often in reports; "percentage of bases at Q30 or above" is a standard summary of how good a run was, and above 85 to 90% is typical for a healthy Illumina run.
From number to character
To store Q in text, the file adds an offset to Q and writes the character with that ASCII code. Modern files use offset 33 (the "Sanger" encoding): Q = ord(character) - 33. The character ! (ASCII 33) is Q0, + is Q10, 5 is Q20, ? is Q30 and I (ASCII 73) is Q40. Some very old Illumina pipelines used offset 64, which is why tools such as FastQC "guess" the encoding. If you decode with the wrong offset the numbers come out impossible (negative scores, or all values above 60), which is a quick way to notice the mistake. Some newer instruments also bin their qualities into only a few levels to save space, so you may see just four or five distinct characters in a file.
A worked example
Decode the quality line IIIIHHGGGFFFEEC#####. Take each character's ASCII code and subtract 33: I is 73, so Q = 40; H is 39; G is 38; F is 37; E is 36; C is 34; and # (ASCII 35) is Q2. The read starts excellent and ends terrible. The expected number of wrong bases in a read is the sum of the individual error probabilities. The first fifteen bases contribute about 0.0026 in total, while each # base contributes 10^(-0.2), about 0.63. The five # bases alone are expected to be wrong about three times. That is the numerical reason to trim such a tail: it carries almost no trustworthy information and a lot of noise.
Reading a quality report
Run FastQC on a FASTQ file and it produces a single HTML page of plots. MultiQC then gathers the reports from dozens of samples into one page so you can compare them. The panels worth knowing:
- Per-base sequence quality. A box plot of quality at each position along the read. Illumina reads normally start high and decline gently toward the 3' end. A sudden cliff, or a dip in the middle across many reads, points at a hardware problem such as a bubble in the flow cell.
- Per-sequence quality scores. The distribution of each read's mean quality. A second hump at low values means a batch of bad reads.
- Per-base sequence content. For ordinary genomic DNA, the four bases should be nearly flat along the read. RNA-seq and some library methods show an expected bias in the first 10 or so bases.
- GC content. Should look like a bell curve centred near the genome's GC percentage. A second peak suggests contamination, such as a bacterial or human sample in a plant library.
- Adapter content. The fraction of reads that run through the fragment into the adapter. High values mean many fragments were shorter than the read length.
- Duplication levels and overrepresented sequences. Useful for spotting PCR over-amplification, though for RNA-seq, duplicates are partly expected.
FastQC raises green, amber and red flags, but they are generic rules and the "red" on a panel can be perfectly normal for your protocol. Treat them as questions, not verdicts.
Trimming and filtering
Tools such as fastp, cutadapt and Trimmomatic apply a few standard cleanups:
- Adapter trimming. When a fragment is shorter than the read length, the sequencer reads past the end of the genomic DNA and into the adapter. The adapter bases would otherwise be mapped as mismatches or cause the read to fail mapping. Paired-end tools can also detect adapters by checking whether the two mates overlap.
- Quality trimming. Cut the read where the quality drops. A common recipe is a sliding window of four bases: scan from the start and cut when the mean quality of the window falls below 20.
- Length filtering. Drop reads that are too short afterwards (for example under 30 bases), because very short sequences map ambiguously.
- Low-complexity and N filtering. Remove reads that are mostly one base or have many
Ns.
Trimming is a trade-off. Modern mappers such as BWA-MEM soft-clip bad ends on their own, so aggressive quality trimming is often unnecessary for DNA variant calling, but adapter removal still helps. For some analyses (de novo assembly, small RNA) trimming matters more. Whatever you choose, apply it consistently and report it.
Common misconceptions
"Q30 means 30% errors." No. Q30 is a score; the error probability is 10^(-3) = 0.1%. A larger Q is better.
"If the quality is high, the base is certainly right." Phred scores are estimates calibrated on typical data. They cannot reveal systematic errors, such as a sequence-specific mistake the chemistry makes every time, or a sample swap. Quality control checks the data's health, not the biology's truth.
"I can filter a FASTQ file with ordinary text commands." Reads span four lines and mates must stay in step across two files, so use FASTQ-aware tools.
Try it
Start by decoding a quality string and trimming it. Then look at the per-base quality pattern of simulated reads (a model of the real thing, not measured data). Finally, drag the slider to see how the Q score maps to an error rate.
Press Run (or Ctrl + Enter) to see the result here.
Program input · what you'd type while the program runs
Type the answers before you press Run, one per line. Each time the program reads a line (with input()), it gets the next line from this box.
Press Run (or Ctrl + Enter) to see the result here.
Program input · what you'd type while the program runs
Type the answers before you press Run, one per line. Each time the program reads a line (with input()), it gets the next line from this box.
Check your understanding
Quick check · 5 questions
of 5 answered You scored / 5 · perfect!
-
1. A base has Phred score Q = 20. What is the probability that the base call is wrong?
P = 10^(-20/10) = 10^(-2) = 0.01, which is 1%. -
2. With offset 33, which Phred score does the character '5' (ASCII 53) represent?
Q = ord('5') - 33 = 53 - 33 = 20. -
3. Why can't you recognise a FASTQ record by looking for a line that starts with '@'?
'@' is a valid quality character (Q31), so parsers read the file in blocks of four lines. -
4. What problem do adapter sequences in reads cause?
Adapter bases come from the library preparation, not the organism, so they do not match the reference. -
5. Q30 versus Q20: how much lower is the expected error rate at Q30?
Every 10 points of Q is a tenfold change: 1 in 1,000 versus 1 in 100.
Summary
- A FASTQ record has four lines:
@name, bases,+, and one quality character per base. - Phred score
Q = -10 * log10(P); every 10 points is a tenfold lower error rate. Q30 means 1 error in 1,000. - With offset 33,
Q = ord(character) - 33; a wrong offset shows up as impossible numbers. - FastQC and MultiQC summarize quality, GC content, adapters and duplicates; treat their flags as prompts for investigation.
- Trim adapters and bad tails with FASTQ-aware tools, keep mates in sync, and record what you did.
Track your progress
Create a free account to tick off lessons and pick up where you left off on any device.
of Bioinformatics lessons completed