


















Lesson 9 of 49 · Biological Data and Databases
FASTQ and Phred quality scores
Decode FASTQ quality strings, convert Phred scores to error probabilities, average quality correctly, and trim low-quality read ends, with runnable Python.
No sequencing machine is perfect. Each base it reports comes with a small chance of being wrong, and that chance is not the same for every base: it usually grows towards the end of a read and drops when the signal is clean. Rather than hide this, sequencers print a confidence value for every single base. The convention they use, the Phred quality score, is one of the most widely used numbers in biology, and a good grasp of it separates careful analysis from careless analysis.
What you will learn
- How a Phred score Q relates to the probability p that a base is wrong.
- How to decode a FASTQ quality string with the ASCII offset of 33.
- Why the average quality of a read must be computed from probabilities, not from Q values.
- How trimming removes low-quality ends and what it costs.
Key terms
- Phred score (Q):
Q = -10 * log10(p), where p is the estimated probability that the base call is wrong. - Quality string: one ASCII character per base encoding that base's Q.
- Phred+33: the standard encoding: character code = Q + 33.
- Expected errors: the sum of p over all bases in a read.
- Trimming: removing low-quality bases (and adapters) from read ends.
From probability to score
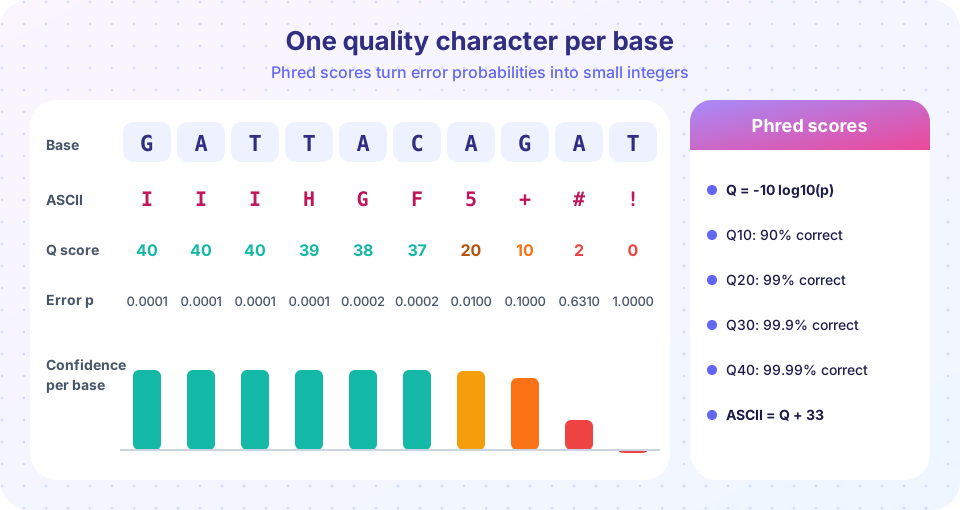
A Phred score turns a tiny probability into a small whole number. Q10 means a 1 in 10 chance of error (90% accuracy). Q20 means 1 in 100 (99%). Q30 means 1 in 1,000 (99.9%) and Q40 means 1 in 10,000 (99.99%). Each step of 10 points makes the base ten times more likely to be right. The scale is logarithmic for the same reason the decibel scale is: the interesting differences are ratios.
The score was introduced in the late 1990s by Phil Green and Brent Ewing with the program phred, which read the signal traces from Sanger sequencing during the Human Genome Project. The idea outlived the program, and today every major sequencing platform reports qualities on the same scale. A given Q is a prediction made by the instrument's software. Well-calibrated platforms deliver roughly the error rate they claim, but calibration can drift, which is why quality control still matters.
To go back and forth you need only two formulas:
Q = -10 * log10(p) p = 10 ** (-Q / 10)
For example, p = 0.001 gives Q = -10 × (-3) = 30, and Q = 13 gives p = 10^(-1.3) ≈ 0.05.
Quality characters
A quality string must keep one score per base in a single readable character. The standard encoding adds 33 to Q and prints the ASCII character with that code. The offset of 33 is used because the first 32 ASCII codes are non-printing control characters, and code 33, the exclamation mark !, is the first visible one. So ! means Q0, + means Q10 (code 43), 5 means Q20 (code 53), ? means Q30 (code 63) and I means Q40 (code 73). Modern Illumina software (version 1.8 and later) and most public archives use this scheme, called Phred+33 or Sanger encoding. Some older Illumina data (1.3 to 1.7) used an offset of 64. If you decode with the wrong offset the scores look absurd, with negative values or numbers above 60, so always inspect the characters first: any character below ; (code 59) means the data is Phred+33.
Some newer instruments report only a handful of distinct quality values ("binned" qualities) to shrink file sizes. Such data decodes in exactly the same way; it just has fewer distinct values.
Averaging the right way
Suppose a four-base stretch has qualities 30, 30, 30 and 10. A quick average of the Q values gives 25. But that number hides the fact that the last base is a hundred times more error-prone than the others. The correct summary averages the error probabilities, then converts back: p values 0.001, 0.001, 0.001 and 0.1 average to 0.02575, which is Q ≈ 15.9. The probability-based number is lower because bad bases dominate the error count, exactly as they should.
A useful related number is the expected number of errors in a read, sum(p_i). A 150-base read of uniformly Q30 bases is expected to contain about 0.15 errors; a read where the last 50 bases are Q10 would contain about 5 errors from that stretch alone. Many pipelines discard reads whose expected error count exceeds a threshold.
Trimming
Quality usually falls along a read, so the end carries the most errors. Trimming programs cut these ends. A common method is a sliding window: move a window of a few bases (say 4) from the start and cut the read where the window's mean quality falls below a threshold (say 20). Another method trims from the 3′ end until a base above the threshold is found. Adapter trimming is a separate step that removes the synthetic adapter sequence that appears when the DNA fragment is shorter than the read.
Trimming has a cost: you lose data and shorten reads. Very short reads map ambiguously. A sensible rule is to trim gently and discard reads that end up shorter than a minimum length, typically 30 to 50 bases for short-read data. Always visualize the quality before and after, using a report tool such as FastQC (per-base quality boxplots) and a summarizer such as MultiQC.
A realistic quality-control workflow
A typical routine looks like this. Run FastQC on each FASTQ file to see per-base quality, per-read quality, base composition, duplication and adapter content. Combine the reports of many files with MultiQC. Decide from the plots whether trimming is needed: a steady decline at the 3′ end suggests trimming the last bases, a sharp drop at one position may indicate a technical fault, and adapter sequence in the report calls for adapter trimming. Trim with a tool such as fastp, cutadapt or Trimmomatic, then run FastQC again to confirm that the problem has disappeared. Record the tool versions and parameters. This simple loop of inspect, trim and re-inspect catches most problems before they can contaminate downstream results such as read mapping or assembly.
Common misconceptions
- "Q30 means 30% accuracy." It means 99.9% accuracy (1 error in 1,000).
- "Average the Q values to get a read's quality." Average the probabilities instead; low-quality bases dominate.
- "High quality means the base is biologically correct." Quality measures sequencing error only. A base can be sequenced perfectly from a damaged or contaminated molecule.
- "All FASTQ files use the same offset." Almost all current data uses Phred+33, but check.
Try it
Press Run (or Ctrl + Enter) to see the result here.
Program input · what you'd type while the program runs
Type the answers before you press Run, one per line. Each time the program reads a line (with input()), it gets the next line from this box.
Press Run (or Ctrl + Enter) to see the result here.
Program input · what you'd type while the program runs
Type the answers before you press Run, one per line. Each time the program reads a line (with input()), it gets the next line from this box.
Check your understanding
Quick check · 5 questions
of 5 answered You scored / 5 · perfect!
-
1. A base has Phred score Q30. What is the probability that it is wrong?
p = 10^(-30/10) = 10^-3 = 0.001, so 99.9% accuracy. -
2. Which character encodes Q20 in Phred+33?
Q20 + 33 = 53, the ASCII code of the character 5. -
3. Two bases have Q30 and Q10. What is the best summary of their average quality?
Mean p = (0.001 + 0.1) / 2 = 0.0505, which is Q = 12.97. -
4. Why is a quality string sometimes mistaken for a header line in FASTQ?
The character @ is a valid quality character, so you must read FASTQ in groups of four lines. -
5. What is a cost of aggressive trimming?
Trimming discards bases, and very short reads map ambiguously, so balance quality and length.
Summary
- Q = -10 log10(p): Q20 is 99% accurate, Q30 is 99.9% and Q40 is 99.99%.
- FASTQ stores each Q as a character with code Q + 33.
- Average error probabilities, not Q values; expected errors are the sum of p.
- Trim low-quality ends with a sliding window, but keep enough length; check results with a QC report.
Next: Chapter 2 review
Track your progress
Create a free account to tick off lessons and pick up where you left off on any device.
of Bioinformatics lessons completed