


















Lesson 47 of 49 · Projects and Practice
Bioinformatics Glossary: Chapters 5 to 8
A plain-language glossary of more than seventy terms from genomics pipelines, RNA-seq, structural bioinformatics and machine learning, with a searchable widget.
Every field speaks in shorthand, and bioinformatics speaks in three at once: biology, computing and statistics. A term like "depth" or "library" means something precise here and something vaguer in everyday life. This glossary collects the vocabulary of the second half of the course, with short definitions in plain language, so you can look a word up in seconds and get back to the lesson.
Terms are grouped alphabetically. Where a term has a formula, it is written in code font. Each entry names the lesson area where you met it, so you can go back for the full story.
How to use this glossary
- Browse the alphabetical lists below when you want a quick refresher.
- Search with the widget at the end of the page.
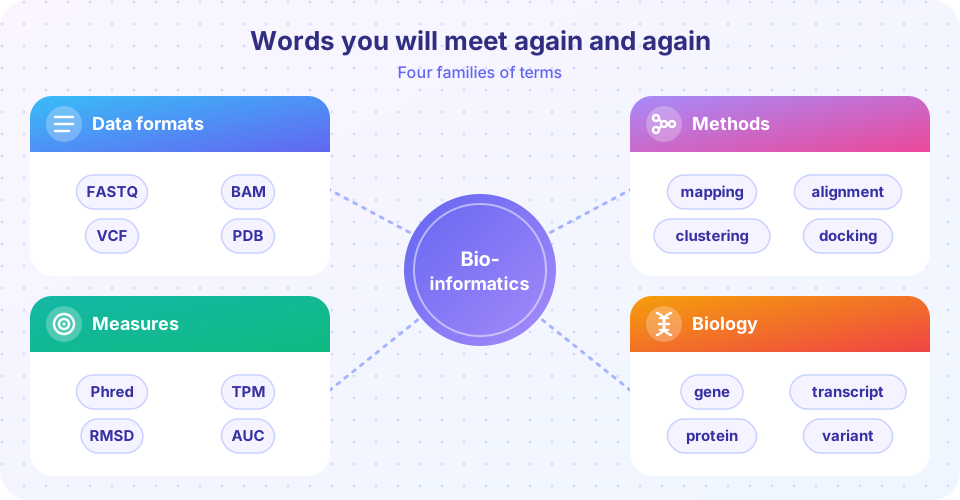
- Group by family using the concept map: formats are the files, methods are what you do to them, measures are the numbers you report, and biology is what it all means.
- Link back to the lessons: genomics pipelines (chapter 5), transcriptomics (chapter 6), structural bioinformatics (chapter 7) and machine learning (chapter 8).
A to C
- Adapter: a known synthetic sequence attached to DNA fragments during library preparation; it can appear in reads and must be trimmed (chapter 5).
- Allele: one version of a sequence at a position; the reference allele (REF) and alternate allele (ALT) in a VCF.
- Alignment: a position-by-position matching of a read or a sequence against a reference, written as a CIGAR string in SAM.
- Annotation: information attached to genes or variants, such as gene names, consequences, population frequencies and pathways.
- AUC: the area under a curve; for a ROC curve it is the probability that a random positive scores higher than a random negative.
- B-factor: a per-atom number in a PDB file describing how much the atom's position is smeared by motion and disorder.
- Backbone: the repeating N, C-alpha, C atoms that form the main chain of a protein.
- BAM: the compressed binary form of SAM, holding aligned reads; usually sorted by coordinate and indexed.
- Batch effect: a systematic technical difference between groups of samples processed at different times or places.
- Benjamini-Hochberg (BH): a procedure that controls the false discovery rate across many tests by comparing sorted p-values to
(rank / m) * q. - Bonferroni correction: a strict multiple-testing correction that divides the significance threshold by the number of tests.
- CIGAR: a compact string such as
5S40M2I20Mdescribing how a read aligns to the reference. - Confusion matrix: a table of true positives, false positives, false negatives and true negatives at one threshold.
- Contact map: a matrix showing which pairs of residues are close in space, often defined as C-beta atoms within 8 angstroms.
- Coverage (depth): the average number of reads overlapping each position;
N * L / Gfor N reads of length L over a genome of size G. - CPM: counts per million,
count / total counts * 1,000,000; corrects for sequencing depth but not for gene length. - CRAM: a reference-based compressed alignment format that is smaller than BAM.
D to K
- Data leakage: information from the test set reaching training, so the evaluation is optimistic; homology between train and test sequences is the classic cause.
- Differential expression (DE): a statistically supported difference in a gene's expression between conditions.
- Dihedral angle: the twist around a bond defined by four atoms; phi and psi describe the protein backbone.
- Dispersion: how much more variable counts are than Poisson, the alpha in
Var = mu + alpha * mu^2. - Docking: predicting how a small molecule fits into a protein's binding site, using a search and a scoring function.
- DSSP: an algorithm that assigns secondary structure (helix, strand, turn) from hydrogen-bond patterns in a structure.
- Embedding: a learned vector of numbers that represents a token, a residue or a whole sequence.
- Enrichment analysis: testing whether a gene list overlaps a gene set more than chance predicts.
- FASTA: a simple text format with a header line starting with
>followed by sequence lines. - FASTQ: a text format with four lines per read: name, bases, a plus sign and per-base quality characters.
- FDR (false discovery rate): the expected proportion of false positives among the results called significant.
- FLAG: a number in a SAM record whose bits encode properties of the read, such as paired, reverse strand or duplicate.
- Fold: the overall three-dimensional arrangement of a protein chain.
- Gene Ontology (GO): a curated vocabulary of biological processes, molecular functions and cellular components used to annotate genes.
- Genotype: the alleles a sample carries at a position, written 0/0, 0/1 or 1/1 in a VCF.
- GFF/GTF: tab-separated annotation formats that list genes, transcripts and exons with their coordinates.
- GSEA: gene set enrichment analysis; walks down a ranked list of all genes to find sets whose members cluster at one end.
- Heatmap: a colored matrix, typically genes by samples, ordered by clustering.
- Heterozygous: carrying two different alleles at a position; genotype 0/1.
- Homologous: related through a common evolutionary ancestor; homologous sequences and structures are similar.
- Homozygous: carrying the same allele on both chromosome copies; genotype 0/0 (reference) or 1/1 (alternate).
- Indel: a short insertion or deletion; written in a VCF with an anchor base.
- k-mer: a substring of length k; there are
4^kpossible DNA k-mers.
L to P
- Library: the prepared set of DNA or cDNA fragments with adapters that goes into the sequencer.
- Library size: the total number of reads (or assigned reads) in a sample.
- Ligand: a small molecule that binds to a protein.
- Log2 fold change (LFC):
log2(B / A); 1 means doubled and -1 means halved. - MAPQ: mapping quality in a SAM record, a Phred-scaled estimate that the read's position is wrong; 0 means ambiguous.
- Mapping: finding the reference position that best matches each read; also called alignment of reads.
- mmCIF: the modern table-based text format for macromolecular structures, with no limits on atom or chain counts.
- MSA (multiple sequence alignment): an alignment of many related sequences used to find conserved and co-evolving positions.
- Normalization: scaling data to remove technical differences, such as sequencing depth, before comparison.
- Occupancy: the fraction of molecules in a crystal in which an atom sits at the listed position.
- One-hot encoding: representing each base as a vector with a single 1, such as A = (1, 0, 0, 0).
- Overfitting: fitting noise in the training set so closely that performance on new data suffers.
- PAE: predicted aligned error; the expected positional error between two residues in a predicted structure.
- PCA: principal component analysis; projects data onto a few axes capturing the most variance.
- PDB: the Protein Data Bank, the global archive of experimental structures, with four-character entry identifiers.
- Phred score: a log-scaled error measure,
Q = -10 * log10(P); Q30 means 1 error in 1,000. - Pileup: for each position, the count of each base across reads covering it.
- pLDDT: a per-residue confidence from 0 to 100 for a predicted structure; above 90 is very high.
- Pose: the position, orientation and conformation of a ligand in a binding site.
- Precision:
TP / (TP + FP); the fraction of predicted positives that are real. - Pseudo-alignment: assigning reads to transcripts by compatibility, without full alignment, as Salmon and kallisto do.
Q to Z
- QUAL: in a VCF, the Phred-scaled confidence that the site is truly variant.
- Read: one sequenced fragment of DNA or cDNA.
- Recall (sensitivity):
TP / (TP + FN); the fraction of real positives that were found. - Reference genome: an agreed sequence, such as GRCh38 for humans, against which reads are compared.
- Replicate: an independent biological sample of the same condition; the basis of statistical power.
- Residue: one amino acid within a protein chain.
- RMSD: root-mean-square deviation,
sqrt(mean of d^2), between matched atoms after superposition. - ROC curve: true positive rate against false positive rate as the threshold varies.
- SAM: the tab-separated text format for alignments with eleven required fields.
- SNV: single-nucleotide variant; one base changed relative to the reference.
- Size factor: a per-sample scaling number, estimated by median-of-ratios or TMM, that corrects depth and composition.
- Superposition: translating and rotating one structure to minimize its RMSD to another, for example with the Kabsch algorithm.
- TMM: the trimmed mean of M-values, edgeR's method for finding between-sample scaling factors.
- TM-score: a length-independent structural similarity score between 0 and 1; above about 0.5 usually means the same fold.
- TPM: transcripts per million; divide counts by gene length first, then scale so each sample sums to 1,000,000.
- Transcriptome: all RNA molecules present in a sample at one time.
- Ti/Tv ratio: the ratio of transitions (A-G, C-T) to transversions among SNVs; about 2 for human whole-genome data.
- VCF: variant call format, a text file of variants with eight fixed columns, FORMAT and sample columns.
- Variant: a position where a sample differs from the reference.
- Volcano plot: a scatter of log fold change against
-log10(p)that shows effect size and evidence together. - z-score:
(value - mean) / standard deviation; puts every gene on a common scale before clustering.
Try it
First, the search widget filters a set of terms as you type. Second, a small Python table turns the Phred scale and the AlphaFold confidence bands into a reference you can extend.
Press Run (or Ctrl + Enter) to see the result here.
Program input · what you'd type while the program runs
Type the answers before you press Run, one per line. Each time the program reads a line (with input()), it gets the next line from this box.
Check your understanding
Quick check · 4 questions
of 4 answered You scored / 4 · perfect!
-
1. Which term describes a table of the count of each base at each reference position?
A pileup counts the bases of all reads covering each position. -
2. Which two measures are both based on the Phred log scale?
Base quality scores and mapping quality are both -10 * log10 of an error probability. -
3. What does FDR control?
FDR is the expected fraction of false discoveries among the discoveries you report. -
4. Which value is a per-residue confidence score for a predicted structure?
pLDDT is the per-residue confidence value (0 to 100) of AlphaFold-style models.
Summary
- Keep the four families in mind: data formats, methods, measures and biology.
- The Phred scale appears in base quality, mapping quality and variant quality; always check which question each number answers.
- Normalization terms (CPM, TPM, size factor) differ in what they correct: depth, length, composition.
- Structure terms (B-factor, RMSD, pLDDT, PAE) are all statements about uncertainty or distance.
- Evaluation terms (precision, recall, AUC, leakage) tell you whether to believe a model.
Next: Cheat Sheet
Track your progress
Create a free account to tick off lessons and pick up where you left off on any device.
of Bioinformatics lessons completed