


















Lesson 48 of 49 · Projects and Practice
Bioinformatics Cheat Sheet: Formulas, Formats and Rules of Thumb
A one-page bioinformatics cheat sheet: file formats, Phred and depth formulas, RNA-seq normalization, variant genotypes, structure metrics and machine learning scores.
This page is the one-page recap of chapters 5 to 8. It does not teach anything new: it collects the formats, formulas and thresholds you have met, in the order you will reach for them, with a one-line reminder of what each means. Keep it open next to your analysis, and follow the links to the lessons when a line is not enough.
The numbers here are rules of thumb, not laws. Thresholds such as "Q30" or "padj below 0.05" are conventions that depend on the field and the study; they are included because you will see them constantly, not because they are always right.
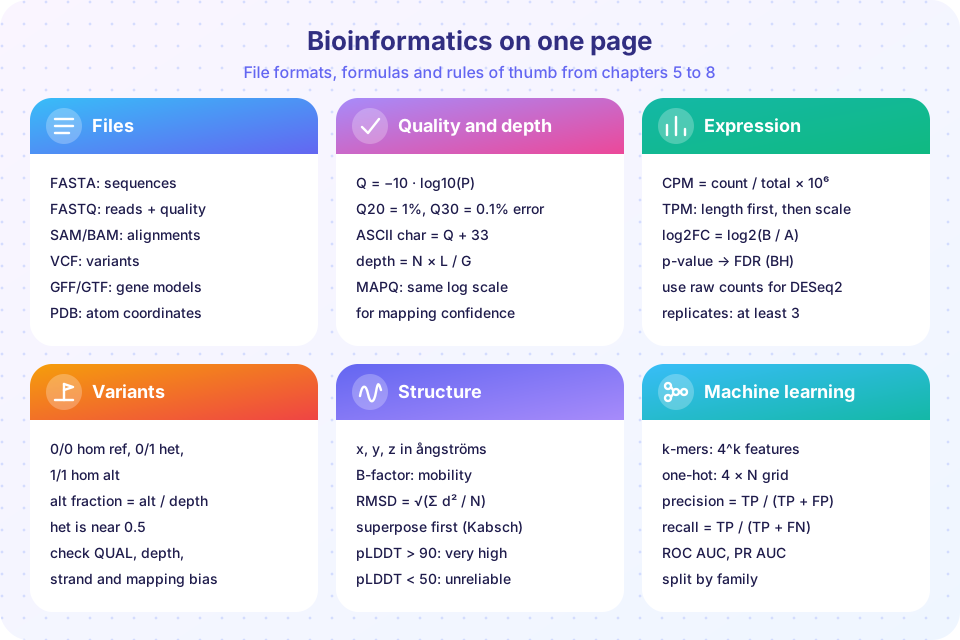
How to use this page
Scan the picture to find the area. Then read the matching section below for the formula's meaning, a worked mini-example and the usual trap. At the end you will find two tools: a Python toolbox that implements every formula, and a small converter for Phred scores, depth and lengths.
Files and formats
- FASTA: header line
>name, then sequence. No qualities. - FASTQ: four lines per read:
@name, bases,+, qualities. Never sort or filter with generic text tools; keep mates in sync. - SAM / BAM / CRAM: alignments. SAM is text with eleven fields; BAM is compressed binary and should be sorted and indexed; CRAM stores differences from the reference.
- VCF: variants with fixed columns
CHROM POS ID REF ALT QUAL FILTER INFO, thenFORMATand one column per sample. - GTF / GFF: gene models with coordinates for genes, transcripts and exons.
- PDB / mmCIF: atom coordinates in ångströms; mmCIF is the modern format without size limits.
- Coordinates: SAM and VCF are 1-based, BED is 0-based. Check before you mix them.
Quality, mapping and depth
Phred scale. Q = -10 * log10(P) and P = 10^(-Q/10). Q10 is 1 error in 10, Q20 is 1 in 100, Q30 is 1 in 1,000, Q40 is 1 in 10,000. In FASTQ the character is chr(Q + 33), so I is Q40 and # is Q2. Mapping quality MAPQ uses the same scale for the chance that the read is placed wrongly; 0 means a multi-mapping read.
Depth. depth = N * L / G for N reads of length L over a genome of size G. For a human genome at 30x with 150-base reads you need roughly 620 million reads. Under the Poisson model the fraction with no reads is e^(-depth): 37% at 1x, 0.03% at 8x.
Worked mini-example. A read with quality characters 5555?????IIII has Q values 20, 30 and 40, a mean of 30 and an expected number of errors of 4 * 0.01 + 5 * 0.001 + 4 * 0.0001 = 0.0454.
Usual traps. Treating Q30 as "30% error"; forgetting that duplicates inflate depth; comparing MAPQ values across different mappers.
RNA-seq and expression
- CPM
= count / total * 10^6: corrects depth only. - TPM
= (count / length) / sum(count / length) * 10^6: length first, sums to a million in every sample; a within-sample measure. - Size factors (median-of-ratios, TMM): between-sample scaling for differential expression, which uses raw counts.
- log2 fold change
= log2(B / A): 1 = doubled, -1 = halved, 0 = unchanged. - Negative binomial:
Var = mu + alpha * mu^2; replicates, not depth, reduce uncertainty. - p-value to FDR: sort p-values, find the largest rank
kwithp(k) <= (k / m) * q, call ranks 1 to k. Adjusted p-values arep * m / rankwith a running minimum from the end. - Enrichment: expected overlap
= list size * set size / universe; test with the hypergeometric or Fisher test; correct across sets.
Worked mini-example. Three genes, lengths 2,000, 500 and 1,000, counts 400, 200 and 300: CPM is 444k, 222k, 333k but TPM is 222k, 444k, 333k. Length correction reverses the ranking of the first two.
Usual traps. Feeding TPM to DESeq2 or edgeR; no replicates; a perfectly confounded batch; using the wrong background in enrichment.
Variants and genotypes
- Genotype codes:
0/0homozygous reference,0/1heterozygous,1/1homozygous alternate,./.missing,|phased. - Alt fraction
= alt reads / depth; heterozygous sites are near 0.5, but a range is normal. - Binomial model: reads showing ALT follow
Binomial(n, e),Binomial(n, 0.5)orBinomial(n, 1 - e)for the three genotypes; multiply by priors, normalize. - QUAL
= -10 * log10(P(site is reference)); high QUAL means confident the variant exists, not that it matters. - Checks: Ti/Tv near 2 for whole-genome SNVs; depth, strand balance, mapping quality, allele balance.
Worked mini-example. Depth 24 with 11 alternate reads is a fraction of 0.46, so 0/1. Depth 6 with 2 alternates is ambiguous and, with a strong reference prior, comes out 0/0.
Usual traps. Reading "no variant" as "reference" when the site was uncovered; mixing reference builds; ignoring indel anchoring.
Structure
- Units: 1 Å = 0.1 nm. Covalent bonds are 1.0 to 1.5 Å, hydrogen bonds 2.6 to 3.2 Å, consecutive C-alpha atoms about 3.8 Å.
- Alpha helix: 3.6 residues per turn, 1.5 Å rise per residue, hydrogen bond from residue i to i+4; phi near -60 and psi near -45.
- Beta strand: phi near -120, psi near +130.
- PDB quality: resolution (lower is better), R-free, B-factor (mobility), occupancy.
- RMSD
= sqrt(mean of d^2)after best superposition (Kabsch: center, SVD, fix the determinant sign). Use TM-score or lDDT when hinges or chain length complicate it. - pLDDT above 90 very high, 70 to 90 confident, 50 to 70 low, below 50 very low; PAE for domain placement.
- Docking success in redocking: ligand RMSD below about 2 Å.
Worked mini-example. Matched distances of 1, 2, 2 and 3 Å give RMSD sqrt(18 / 4) = 2.12 Å, above the mean of 2.0, because the largest deviation counts more.
Usual traps. A mirror-image fit; one RMSD hiding a hinge; trusting side chains in a low-resolution or low-pLDDT region.
Machine learning
- Encodings: k-mer counts have
4^kfeatures and ignore order; one-hot is a 4 by L grid; GC content is one number. - Confusion matrix: precision
= TP / (TP + FP), recall= TP / (TP + FN), specificity= TN / (TN + FP), F1= 2PR / (P + R). - ROC AUC: probability that a random positive outscores a random negative; PR curves and average precision are better for rare positives.
- Splitting: train/validation/test, grouped by family, cluster or chromosome; standardize with training statistics only.
- Controls: a simple baseline and a shuffled-label model; a score above chance on shuffled labels signals a leak.
- Convolution filter: a learned motif scanner, followed by max pooling.
Worked mini-example. 40 true positives, 5 false positives, 10 false negatives and 45 true negatives give precision 0.89, recall 0.80 and accuracy 0.85.
Usual traps. Reporting accuracy for rare classes; random splits of related sequences; tuning on the test set.
Five habits that prevent most mistakes
- Look at the data before and after every step.
- Record the reference build, annotation release and tool versions.
- Keep every command in a script or workflow, never only in your terminal history.
- Compare with a simple baseline and a control.
- Ask what an independent line of evidence would show before you believe a surprising result.
Try it
The Python toolbox below implements each formula from this page as a function, with a worked check for each. The converter lets you move between Phred scores and error rates, compute depth, and convert lengths.
Press Run (or Ctrl + Enter) to see the result here.
Program input · what you'd type while the program runs
Type the answers before you press Run, one per line. Each time the program reads a line (with input()), it gets the next line from this box.
Check your understanding
Quick check · 4 questions
of 4 answered You scored / 4 · perfect!
-
1. A FASTQ quality character has ASCII code 63. What is the Phred score (offset 33)?
63 - 33 = 30, so Q30 (the character '?'). -
2. Which measure is appropriate for comparing the expression of two different genes within one sample?
Different genes have different lengths, so a length-aware measure such as TPM is needed. -
3. Which statement about a heterozygous call is most accurate?
Reads sample the two chromosomes randomly, so the fraction fluctuates around 0.5. -
4. Which of the following would you use to detect a leak in a machine-learning evaluation?
A model without real signal must perform at chance; a higher score exposes leakage.
Summary
- Know the formats: FASTQ (reads and qualities), SAM/BAM (alignments), VCF (variants), GTF (genes), PDB or mmCIF (atoms).
- Phred (
-10 log10 P), depth (N * L / G), TPM, log2 fold change, BH, RMSD and precision/recall are the formulas you will use most. - Thresholds are conventions; record your choices and test sensitivity to them.
- Habits matter most: inspect, record versions, script everything, compare with baselines and ask for independent evidence.
Next: Further Study
Track your progress
Create a free account to tick off lessons and pick up where you left off on any device.
of Bioinformatics lessons completed